NLRB Stats Archive › Annual Reports › FY1984 › Industrial distribution of representation elections
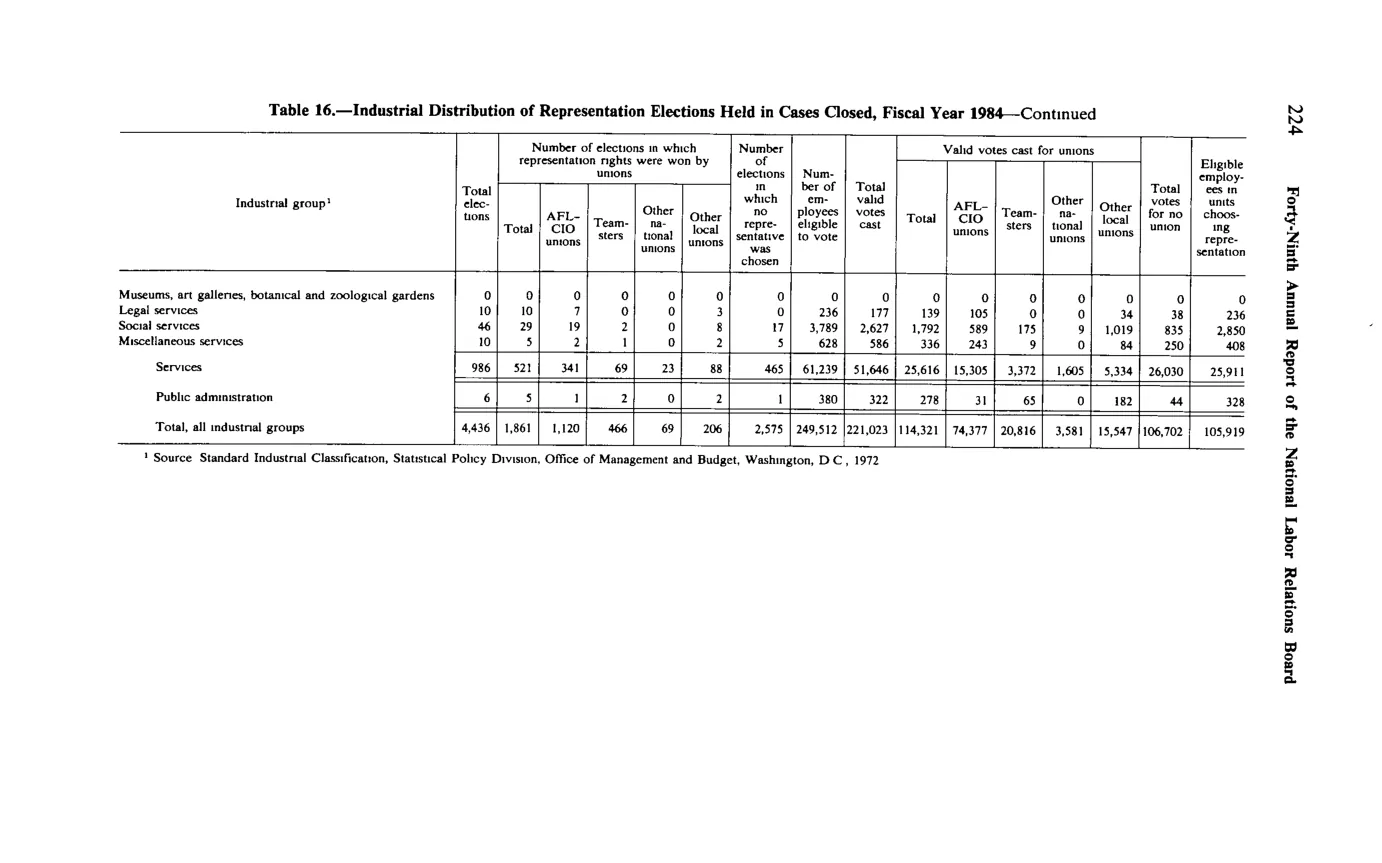
Industrial distribution of representation elections
| Industrial group | Total elections | Number of elections in which representation rights were won by unions — Total | AFL-CIO unions | Teamsters | Other national unions | Other local unions | Number of elections in which no representative was chosen | Number of employees eligible to vote | Total valid votes cast | Valid votes cast for unions — Total | Valid votes cast for unions — AFL-CIO unions | Valid votes cast for unions — Teamsters | Valid votes cast for unions — Other national unions | Valid votes cast for unions — Other local unions | Total valid votes cast for no representation | Eligible employees in elections choosing no representation |
|---|---|---|---|---|---|---|---|---|---|---|---|---|---|---|---|---|
| Museums, art galleries, botanical and zoological gardens | 0 | 0 | 0 | 0 | 0 | 0 | 0 | 0 | 0 | 0 | 0 | 0 | 0 | 0 | 0 | 0 |
| Legal services | 10 | 7 | 0 | 0 | 0 | 7 | 3 | 236 | 177 | 139 | 0 | 0 | 0 | 105 | 0 | 236 |
| Social services | 46 | 29 | 19 | 2 | 0 | 8 | 17 | 3,789 | 2,627 | 1,792 | 589 | 175 | 9 | 1,019 | 835 | 2,850 |
| Miscellaneous services | 10 | 5 | 2 | 1 | 0 | 2 | 0 | 628 | 586 | 336 | 243 | 9 | 0 | 0 | 250 | 408 |
| Services — Industry-group subtotal | 986 | 521 | 341 | 69 | 23 | 88 | 465 | 61,239 | 51,646 | 25,616 | 15,305 | 3,372 | 1,605 | 5,334 | 26,030 | 25,911 |
| Public administration | 6 | 5 | 1 | 2 | 0 | 2 | 1 | 380 | 322 | 278 | 31 | 65 | 0 | 182 | 44 | 328 |
| Total, all industrial groups (GRAND TOTAL) | 4,436 | 1,861 | 1,120 | 466 | 69 | 206 | 2,575 | 249,512 | 221,023 | 114,321 | 74,377 | 20,816 | 3,581 | 15,547 | 106,702 | 105,919 |
Source image
Source data: U.S. NLRB Annual Reports (public domain). Reconstruction by NLRB Stats Archive. Updated June 2026.