NLRB Stats Archive › Annual Reports › FY1984 › Collective-bargaining elections held in cases closed
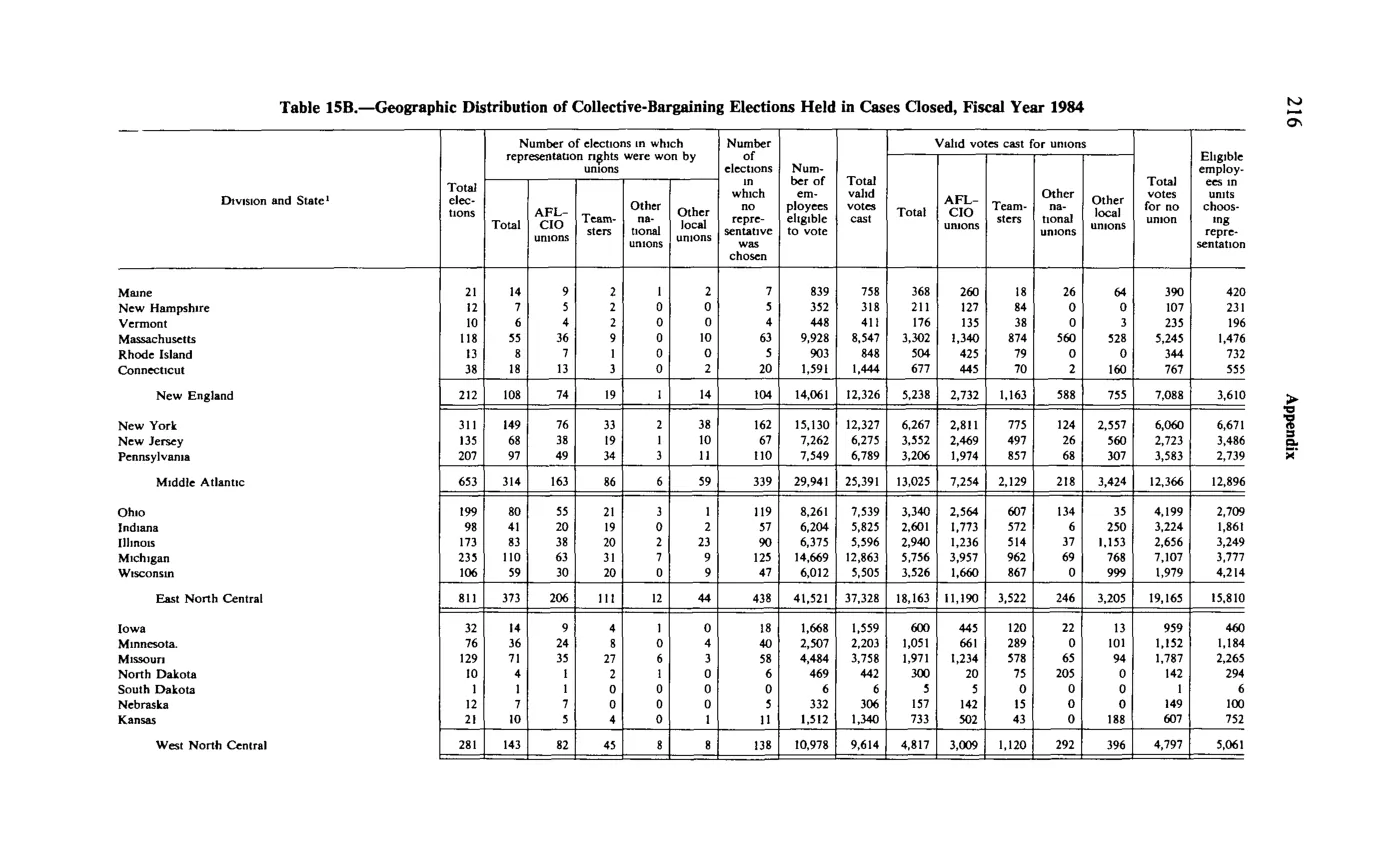
Collective-bargaining elections held in cases closed
| Division and State | Total elections | Number of elections in which representation rights were won by unions — Total | AFL-CIO unions | Teamsters | Other national unions | Other local unions | Number of elections in which no representative was chosen | Number of employees eligible to vote | Total valid votes cast | Valid votes cast for unions — Total | Valid votes cast for unions — AFL-CIO unions | Valid votes cast for unions — Teamsters | Valid votes cast for unions — Other national unions | Valid votes cast for unions — Other local unions | Total valid votes cast for no representation | Eligible employees in elections choosing no representation |
|---|---|---|---|---|---|---|---|---|---|---|---|---|---|---|---|---|
| Maine | 21 | 14 | 9 | 2 | 1 | 2 | 7 | 839 | 758 | 368 | 260 | 18 | 26 | 64 | 390 | 422 |
| Massachusetts | 118 | 36 | 9 | 0 | 10 | 63 | 5,978 | 5,367 | 3,302 | 1,340 | 874 | 562 | 526 | 5,245 | 1,676 | |
| New England — Division subtotal | 212 | 108 | 74 | 19 | 1 | 14 | 104 | 14,061 | 12,336 | 5,238 | 2,732 | 1,163 | 588 | 755 | 7,098 | 3,610 |
| New York | 311 | 149 | 76 | 33 | 2 | 38 | 162 | 15,176 | 12,327 | 6,297 | 2,831 | 1,775 | 234 | 1,455 | 2,557 | 6,060 |
| Middle Atlantic — Division subtotal (NY + NJ + PA) | 653 | 314 | 165 | 80 | 6 | 59 | 339 | 29,941 | 25,391 | 13,025 | 7,254 | 2,219 | 218 | 3,424 | 12,366 | 12,896 |
| East North Central — Division subtotal (OH + IN + IL + MI + WI) | 811 | 373 | 206 | 111 | 12 | 44 | 438 | 41,521 | 37,328 | 18,163 | 11,090 | 3,522 | 246 | 3,205 | 19,165 | 15,810 |
| West North Central — Division subtotal (IA + MN + MO + ND + SD + NE + KS) | 281 | 143 | 82 | 45 | 0 | 16 | 138 | 10,978 | 9,614 | 4,817 | 3,009 | 1,120 | 297 | 396 | 4,797 | 5,061 |
| Per-state |
Source image
Source data: U.S. NLRB Annual Reports (public domain). Reconstruction by NLRB Stats Archive. Updated June 2026.