NLRB Stats Archive › Annual Reports › FY1984 › Disposition of objections in representation cases closed
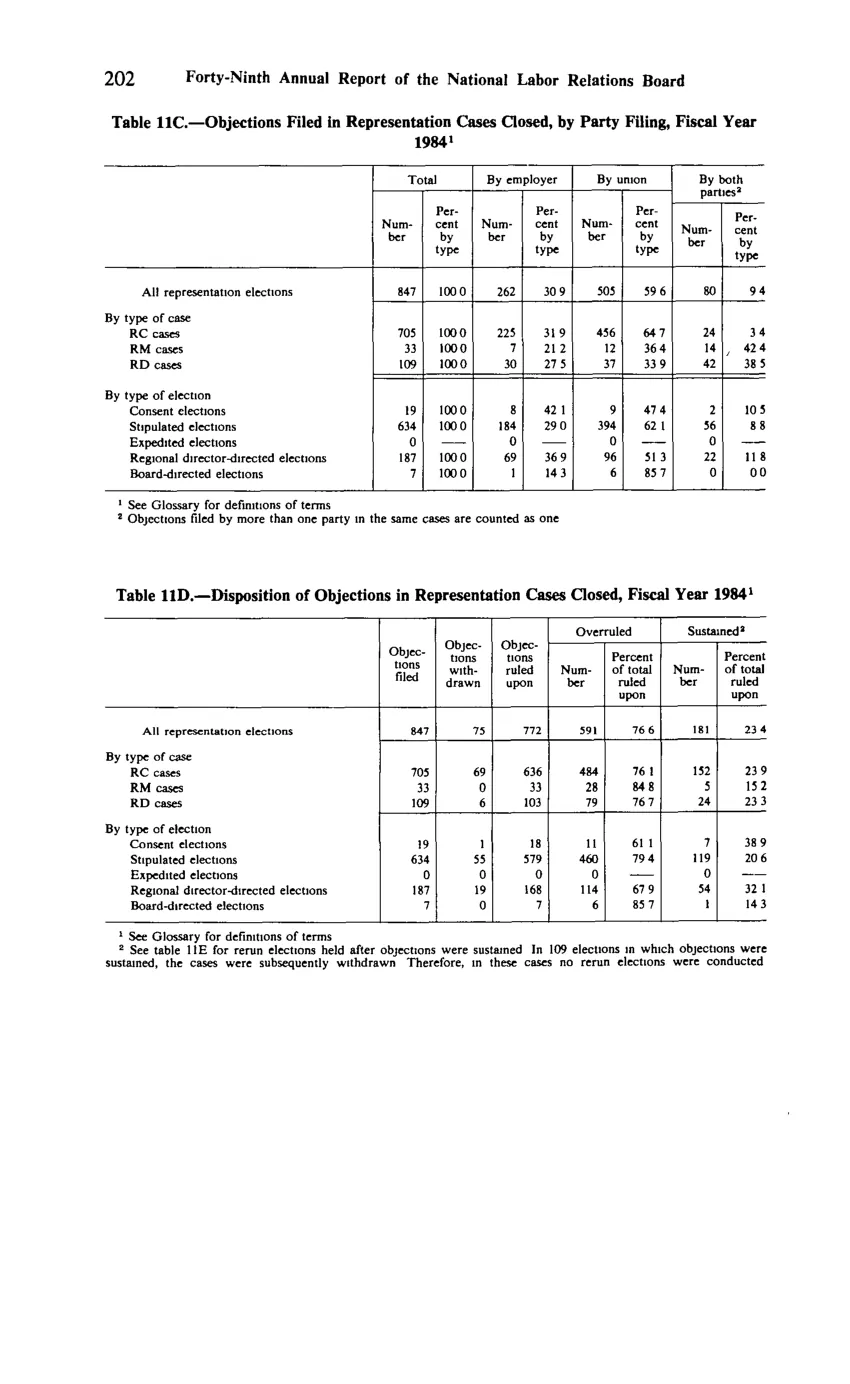
Disposition of objections in representation cases closed
| Type of election / case | Objections filed | Objections withdrawn | Objections ruled upon | Overruled Number | Overruled Percent of total ruled upon | Sustained Number | Sustained Percent of total ruled upon |
|---|---|---|---|---|---|---|---|
| All representation elections | 847 | 75 | 772 | 591 | 76.6 | 181 | 23.4 |
| By type of case — RC cases | 705 | 69 | 636 | 484 | 76.1 | 152 | 23.9 |
| By type of case — RM cases | 33 | 0 | 33 | 28 | 84.8 | 5 | 15.2 |
| By type of case — RD cases | 109 | 6 | 103 | 79 | 76.7 | 24 | 23.3 |
| By type of election — Consent elections | 19 | 1 | 18 | 11 | 61.1 | 7 | 38.9 |
| By type of election — Stipulated elections | 634 | 55 | 579 | 460 | 79.4 | 119 | 20.6 |
| By type of election — Expedited elections | 0 | 0 | 0 | 0 | 0 | ||
| By type of election — Regional director-directed elections | 187 | 19 | 168 | 114 | 67.9 | 54 | 32.1 |
| By type of election — Board-directed elections | 7 | 0 | 7 | 6 | 85.7 | 1 | 14.3 |
Source image
Source data: U.S. NLRB Annual Reports (public domain). Reconstruction by NLRB Stats Archive. Updated June 2026.