NLRB Stats Archive › Annual Reports › FY1982 › Size of units in representation cases closed (certification elections, RC and RM)
Size of units in representation cases closed (certification elections, RC and RM)
| Number eligible to vote | Total elections | Percent of total | Cumulative percent of total | AFL-CIO unions — Number | AFL-CIO unions — Percent by size class | Teamsters — Number | Teamsters — Percent by size class | Other national unions — Number | Other national unions — Percent by size class | Other local unions — Number | Other local unions — Percent by size class | Elections in which no representative was chosen — Number | Elections in which no representative was chosen — Percent by size class | |
|---|---|---|---|---|---|---|---|---|---|---|---|---|---|---|
| Total RC and RM elections | 258,626 | 4,247 | 100 | 1,099 | 100 | 473 | 100 | 72 | 100 | 213 | 100 | 2,390 | 100 | |
| Under 10 | 5,888 | 1,025 | 24.1 | 24.1 | 287 | 26.1 | 184 | 38.9 | 19 | 26.4 | 38 | 17.8 | 497 | 20.8 |
| 10 to 19 | 12,961 | 923 | 21.7 | 45.8 | 253 | 23 | 146 | 30.9 | 17 | 23.6 | 63 | 29.6 | 444 | 18.6 |
| 20 to 29 | 10,961 | 322 | 7.6 | 53.4 | 68 | 6.1 | 44 | 9.3 | 5 | 6.9 | 20 | 9.4 | 185 | 7.7 |
| 30 to 39 | 10,639 | 247 | 5.8 | 59.2 | 66 | 6 | 26 | 5.5 | 1 | 1.4 | 13 | 6.1 | 141 | 5.9 |
| 40 to 49 | 9,802 | 177 | 4.2 | 63.4 | 44 | 4 | 15 | 3.2 | 2 | 2.8 | 4 | 1.9 | 112 | 4.7 |
| 50 to 59 | 8,674 | 110 | 2.6 | 66 | 33 | 3 | 12 | 2.5 | 0 | 0 | 8 | 3.8 | 58 | 2.4 |
| 1,000 to 1,999 | 4,969 | 4 | 0.1 | 99.7 | 1 | 0.1 | 0 | 0 | 0 | 0 | 0 | 0 | 3 | 0.1 |
| 2,000 to 2,999 | 12,925 | 5 | 0.1 | 99.8 | 0 | 0 | 0 | 0 | 0 | 0 | 0 | 0 | 5 | 0.2 |
| 3,000 to 9,999 | 4,548 | 2 | 0 | 100 | 0 | 0 | 0 | 0 | 0 | 0 | 0 | 0 | 1 | 0 |
Source image
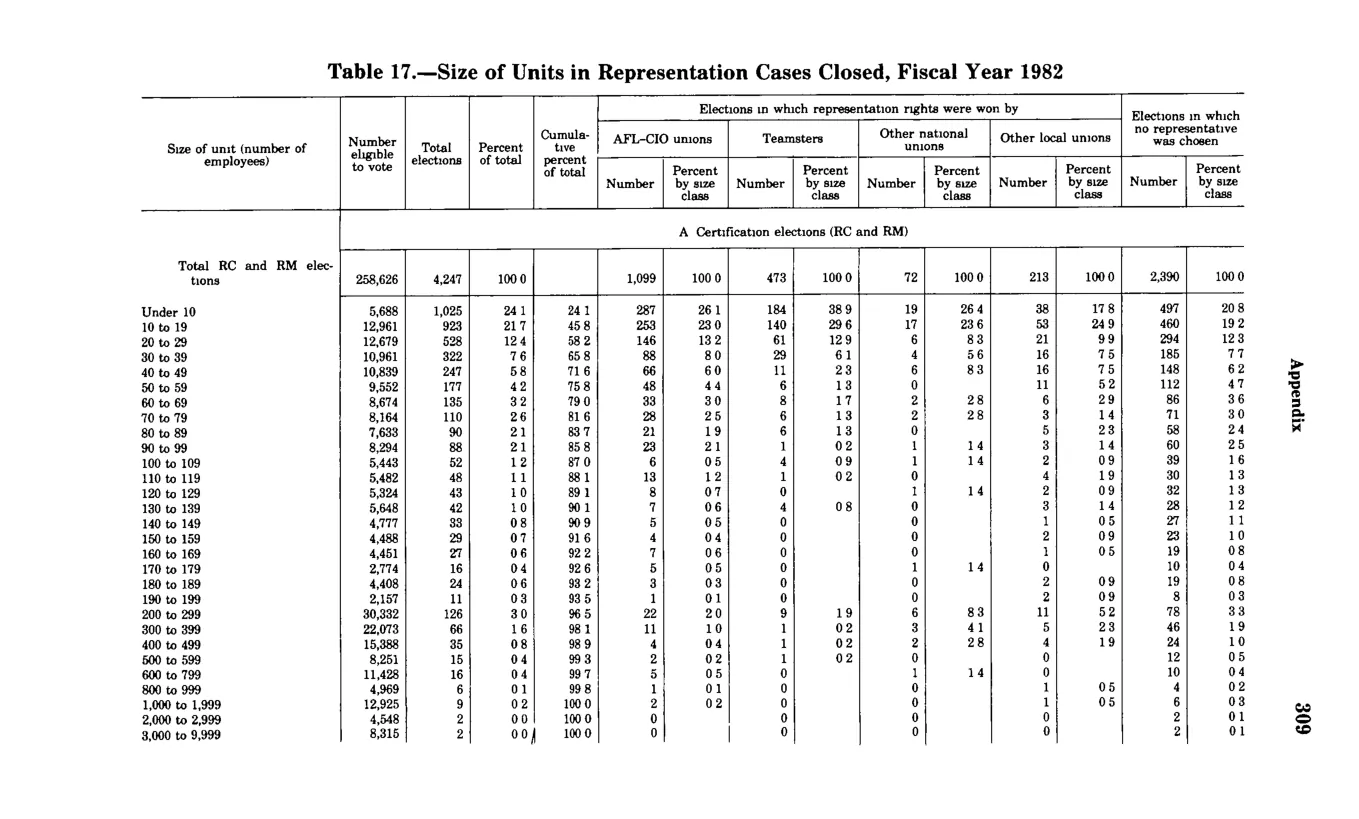
Source data: U.S. NLRB Annual Reports (public domain). Reconstruction by NLRB Stats Archive. Updated June 2026.