NLRB Stats Archive › Annual Reports › FY1982 › Representation elections in cases closed, by industry
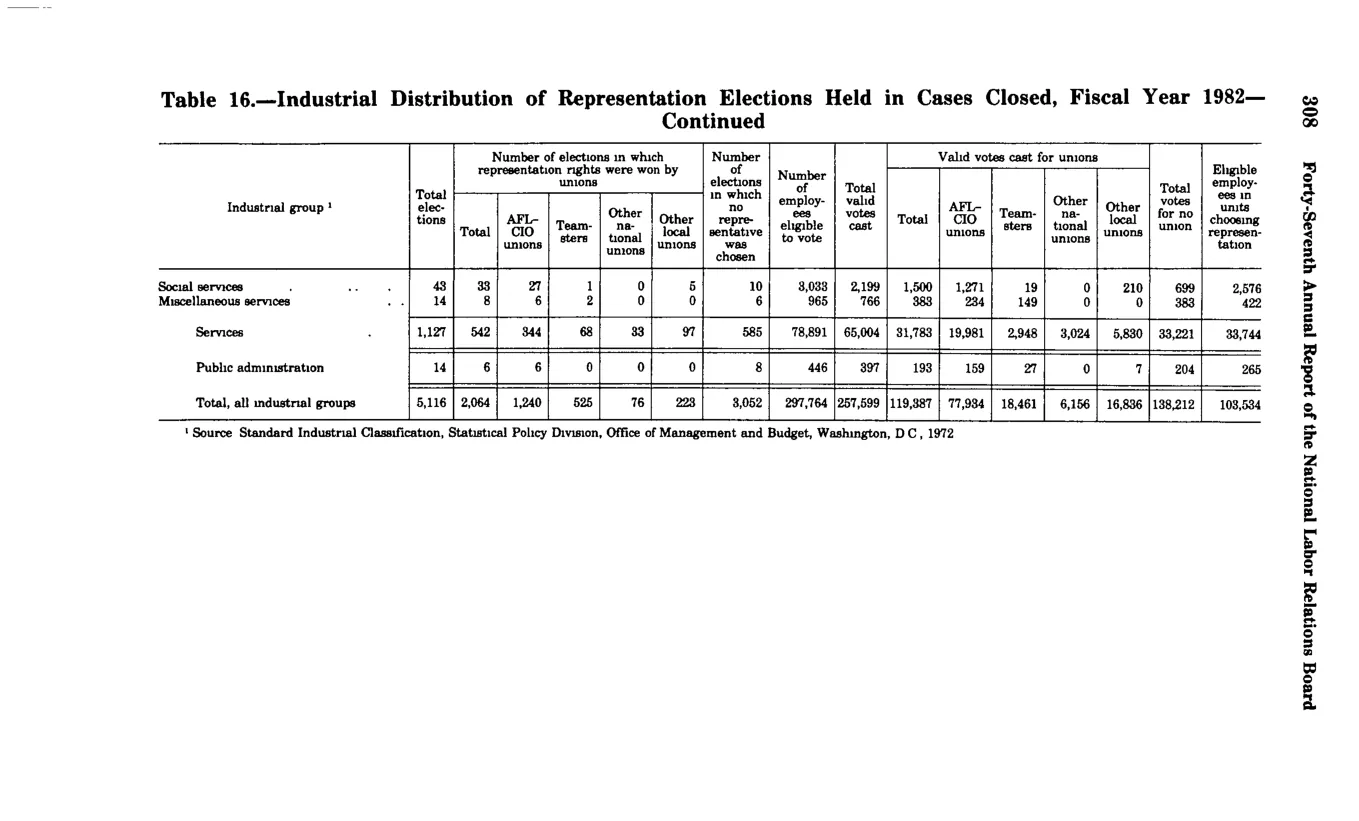
Representation elections in cases closed, by industry
| Social services . Miscellaneous services | 43 14 | 33 8 | 27 6 | 1 2 | 0 o | 5 0 | 10 6 | 3,033 965 | 2,199 766 | 1,500 383 | 1,271 234 | 19 149 | 0 0 | 210 0 | 699 383 | 2,576 422 |
|---|---|---|---|---|---|---|---|---|---|---|---|---|---|---|---|---|
| Services | 1,127 | 542 | 344 | 68 | 33 | 97 | 585 | 78,891 | 65,004 | 31,783 | 19,981 | 2,948 | 3,024 | 5,830 | 33,221 | 33,744 |
| Pubhc administration | 14 | 6 | 6 | 0 | 0 | 0 | 8 | 446 | 397 | 193 | 159 | 27 | o | 7 | 204 | 265 |
| Total, all industrial groups | 5,116 | 2,064 | 1,240 | 525 | 76 | 223 | 3,052 | 297,764 | 257,599 | 119,387 | 77,934 | 18,461 | 6,156 | 16,836 | 138,212 | 103,534 |
Source image
Source data: U.S. NLRB Annual Reports (public domain). Reconstruction by NLRB Stats Archive. Updated June 2026.