NLRB Stats Archive › Annual Reports › FY1980 › Valid votes cast in representation elections (RM cases)
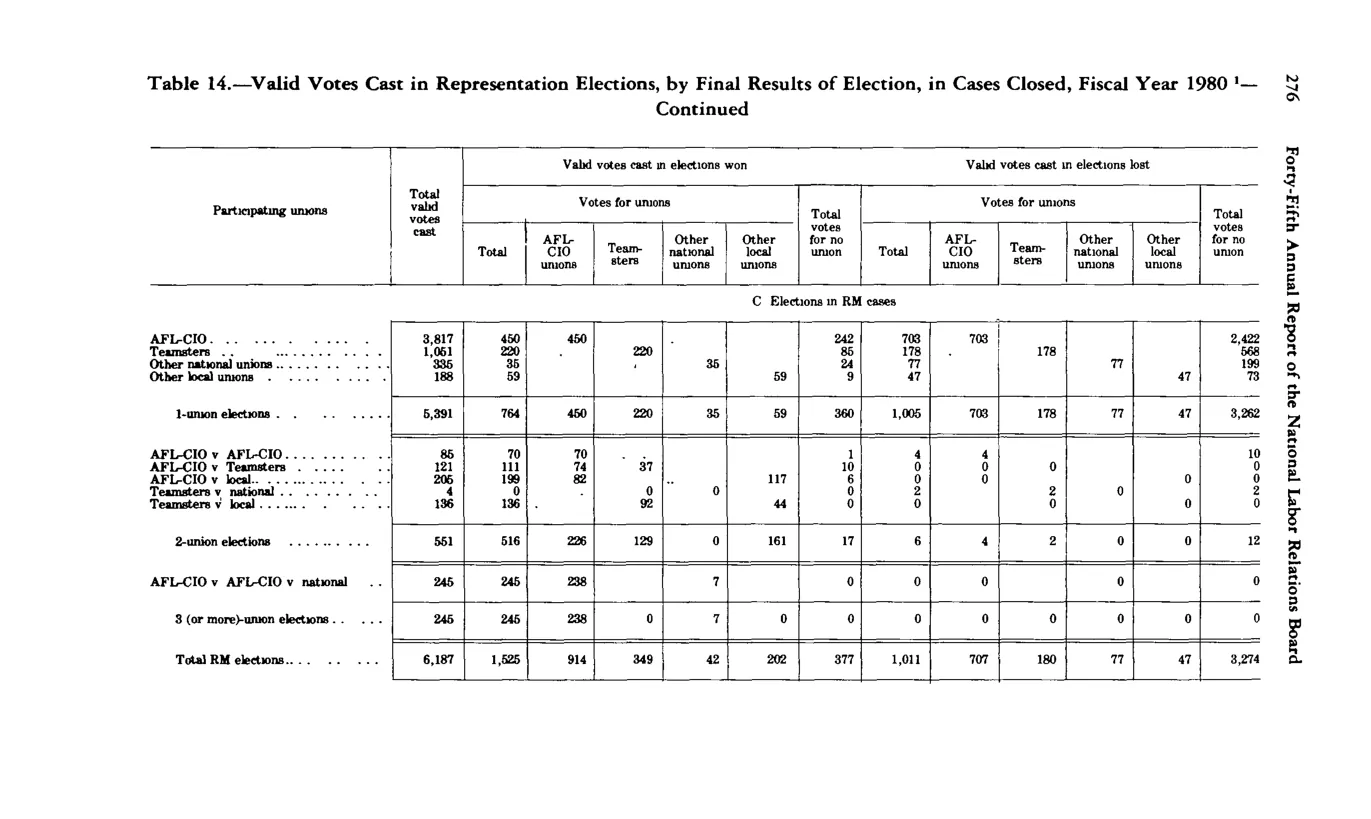
Valid votes cast in representation elections (RM cases)
| Total valid votes cast | Valid votes cast in elections won — Total | Valid votes cast in elections won — Votes for unions — Total | Valid votes cast in elections won — Votes for unions — AFL-CIO unions | Valid votes cast in elections won — Votes for unions — Teamsters | Valid votes cast in elections won — Votes for unions — Other national unions | Valid votes cast in elections won — Votes for unions — Other local unions | Valid votes cast in elections won — Total votes for no union | Valid votes cast in elections lost — Total | Valid votes cast in elections lost — AFL-CIO unions | Valid votes cast in elections lost — Teamsters | Valid votes cast in elections lost — Other national unions | Valid votes cast in elections lost — Other local unions | Valid votes cast in elections lost — Total no union | |
|---|---|---|---|---|---|---|---|---|---|---|---|---|---|---|
| RM 1-union — AFL-CIO | 3,817 | 450 | 450 | 450 | 242 | 703 | 703 | 2,422 | ||||||
| RM 1-union — Teamsters | 1,061 | 220 | 220 | 220 | 85 | 178 | 178 | 568 | ||||||
| RM 1-union — Other national unions | 335 | 35 | 35 | 35 | 59 | 47 | 77 | 199 | ||||||
| RM 1-union — Other local unions | 188 | 55 | 55 | 55 | 47 | 47 | 47 | 73 | ||||||
| RM 1-union elections (subtotal) | 5,391 | 764 | 450 | 220 | 35 | 59 | 360 | 1,005 | 703 | 178 | 77 | 47 | 3,262 | |
| RM 2-union elections (subtotal) | 551 | 516 | 236 | 129 | 161 | 17 | 6 | 4 | 2 | 12 | ||||
| RM 3+-union — AFL-CIO v. AFL-CIO v. national | 245 | 245 | 238 | 7 | ||||||||||
| RM 3 (or more)-union elections (subtotal) | 245 | 245 | 238 | 7 | ||||||||||
| Total RM elections | 6,187 | 1,525 | 914 | 349 | 42 | 202 | 377 | 1,011 | 707 | 180 | 77 | 47 | 3,274 |
Source image
Source data: U.S. NLRB Annual Reports (public domain). Reconstruction by NLRB Stats Archive. Updated June 2026.