NLRB Stats Archive › Annual Reports › FY1979 › Industrial distribution of representation elections held in cases closed
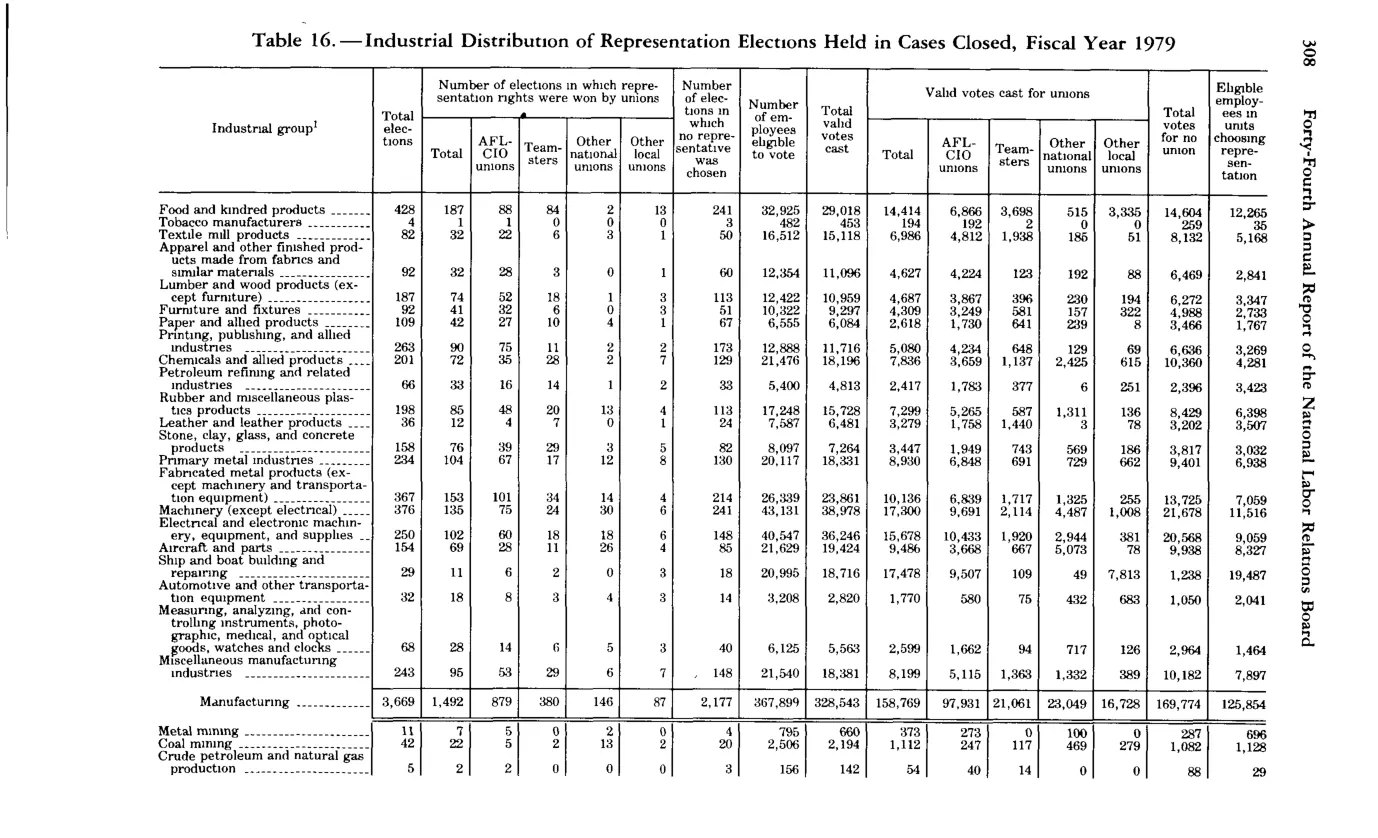
Industrial distribution of representation elections held in cases closed
| Total elections | Won by unions — Total | Won by unions — AFL-CIO | Won by unions — Teamsters | Won by unions — Other national | Won by unions — Other local | Number of elections no representative chosen | Number of employees eligible to vote | Total valid votes cast for unions | Valid votes cast for unions — AFL-CIO | Valid votes cast for unions — Teamsters | Valid votes cast for unions — Other national | Valid votes cast for unions — Other local | Total valid votes cast against unions | Eligible employees in units choosing union representation | |
|---|---|---|---|---|---|---|---|---|---|---|---|---|---|---|---|
| Food and kindred products | 428 | 187 | 88 | 84 | 6 | 9 | 241 | 32,925 | 29,018 | 14,414 | 6,846 | 3,698 | 515 | 3,355 | 12,265 |
| Tobacco manufacturers | 4 | 1 | 1 | 3 | 882 | 453 | 194 | 259 | 150 | ||||||
| Manufacturing (subtotal) | 3,669 | 1,492 | 879 | 380 | 146 | 87 | 2,177 | 367,899 | 326,541 | 159,769 | 97,931 | 21,061 | 23,049 | 18,728 | 169,774 |
Source image
Source data: U.S. NLRB Annual Reports (public domain). Reconstruction by NLRB Stats Archive. Updated June 2026.