NLRB Stats Archive › Annual Reports › FY1979 › Standard Federal Administrative regional distribution of representation elections held in cases closed
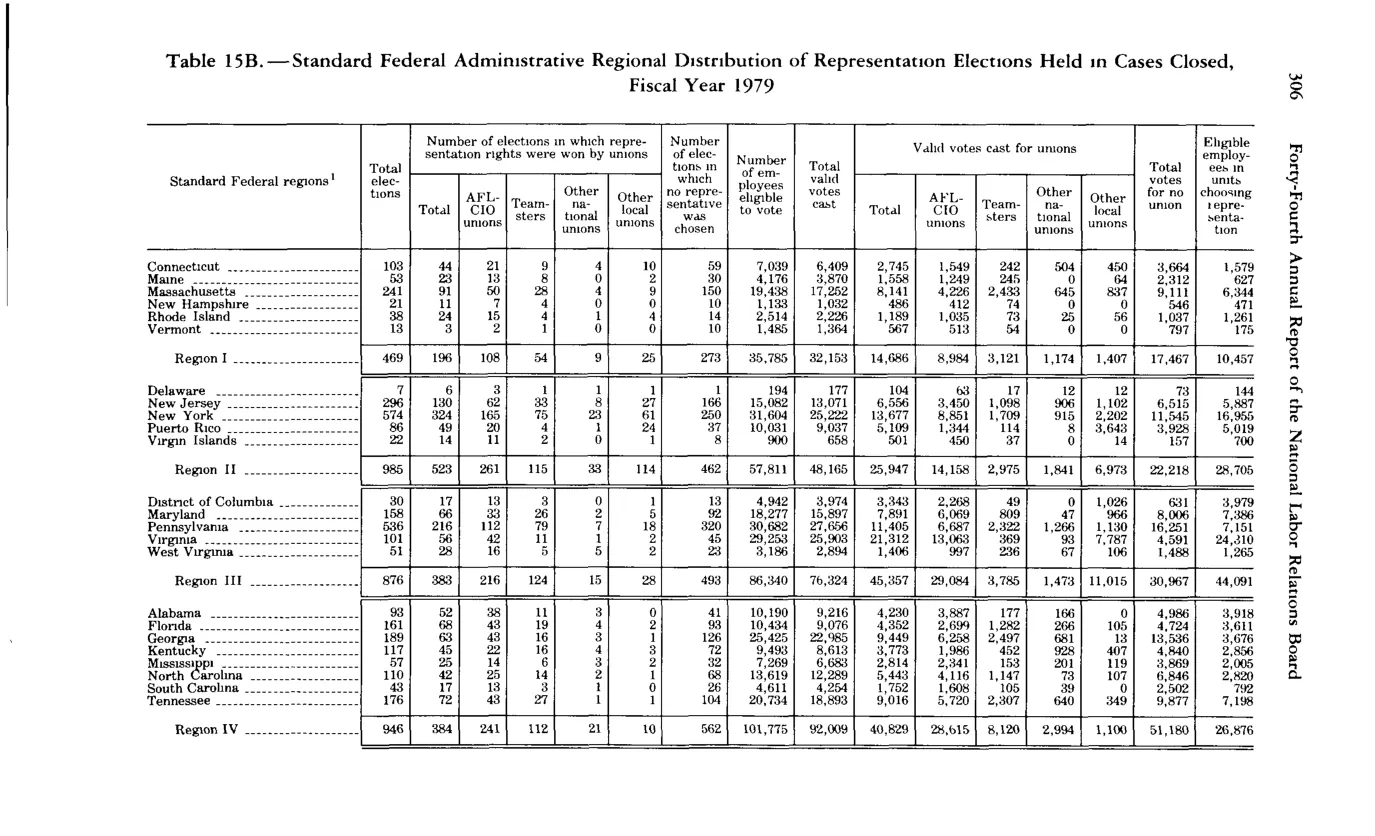
Standard Federal Administrative regional distribution of representation elections held in cases closed
| Total elections | Won by unions — Total | Won by unions — AFL-CIO | Won by unions — Teamsters | Won by unions — Other national | Won by unions — Other local | Number of elections no representative chosen | Number of employees eligible to vote | Total valid votes cast for unions | Valid votes cast for unions — AFL-CIO | Valid votes cast for unions — Teamsters | Valid votes cast for unions — Other national | Valid votes cast for unions — Other local | Total valid votes cast against unions | Eligible employees in units showing representation results | |
|---|---|---|---|---|---|---|---|---|---|---|---|---|---|---|---|
| Region I (subtotal) | 469 | 196 | 108 | 54 | 19 | 9 | 273 | 35,786 | 32,153 | 14,586 | 8,964 | 3,121 | 1,174 | 17,467 | 10,457 |
| Region II (subtotal) | 985 | 523 | 261 | 115 | 33 | 114 | 462 | 57,811 | 48,165 | 25,947 | 14,158 | 2,975 | 4,841 | 22,218 | 28,705 |
| Region III (subtotal) | 876 | 383 | 216 | 124 | 15 | 28 | 493 | 86,349 | 76,323 | 45,357 | 29,084 | 3,786 | 1,478 | 11,015 | 44,091 |
| Region IV (subtotal) | 946 | 384 | 241 | 112 | 27 | 12 | 562 | 101,775 | 92,000 | 40,829 | 26,115 | 8,120 | 2,994 | 51,160 | 26,876 |
Source image
Source data: U.S. NLRB Annual Reports (public domain). Reconstruction by NLRB Stats Archive. Updated June 2026.