NLRB Stats Archive › Annual Reports › FY1979 › Geographic distribution of representation elections in cases closed
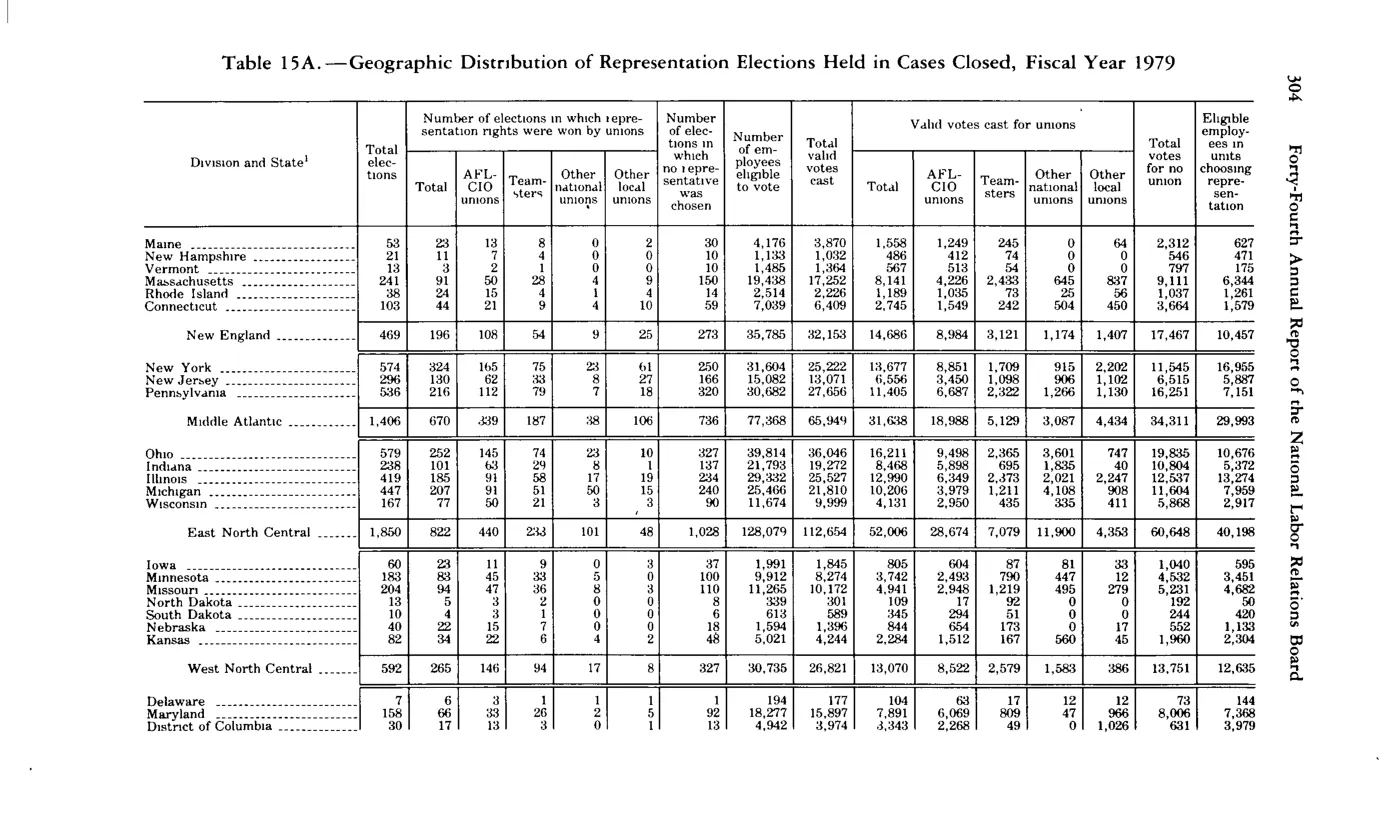
Geographic distribution of representation elections in cases closed
| Total elections | Won by unions — Total | Won by unions — AFL-CIO unions | Won by unions — Teamsters | Won by unions — Other national unions | Won by unions — Other local unions | Number of elections no representative chosen | Number of employees eligible to vote | Total valid votes cast for unions | Valid votes cast for unions — AFL-CIO | Valid votes cast for unions — Teamsters | Valid votes cast for unions — Other national | Valid votes cast for unions — Other local | Total valid votes cast against unions | Eligible employees in units showing representation results | |
|---|---|---|---|---|---|---|---|---|---|---|---|---|---|---|---|
| Maine | 53 | 21 | 11 | 7 | 4 | 0 | 32 | 4,176 | 1,558 | 1,249 | 245 | 0 | 64 | 2,312 | 627 |
| New Hampshire | 13 | 11 | 7 | 4 | 8 | 1,153 | 1,032 | 488 | 412 | 74 | 546 | 471 | |||
| Massachusetts | 241 | 91 | 50 | 26 | 8 | 4 | 144 | 19,438 | 17,252 | 4,228 | 2,433 | 643 | 246 | 9,111 | 6,344 |
| New England (subtotal) | 469 | 196 | 108 | 54 | 19 | 9 | 273 | 35,786 | 32,153 | 14,586 | 8,964 | 3,121 | 1,174 | 17,467 | 10,652 |
| New York | 574 | 324 | 166 | 75 | 33 | 27 | 279 | 44,108 | 35,222 | 13,677 | 8,571 | 915 | 2,202 | 11,545 | 16,955 |
| Middle Atlantic (subtotal) | 1,406 | 670 | 326 | 187 | 59 | 63 | 734 | 77,358 | 65,949 | 31,638 | 9,588 | 5,129 | 3,667 | 4,434 | 34,311 |
| East North Central (subtotal) | 1,850 | 822 | 440 | 233 | 101 | 48 | 1,028 | 128,079 | 112,654 | 52,006 | 28,674 | 7,079 | 11,900 | 4,353 | 60,648 |
| West North Central (subtotal) | 592 | 265 | 146 | 94 | 12 | 13 | 327 | 30,735 | 26,821 | 13,070 | 8,022 | 2,579 | 1,583 | 386 | 12,835 |
Source image
Source data: U.S. NLRB Annual Reports (public domain). Reconstruction by NLRB Stats Archive. Updated June 2026.