NLRB Stats Archive › Annual Reports › FY1979 › Final outcome of representation elections in cases closed (RM cases)
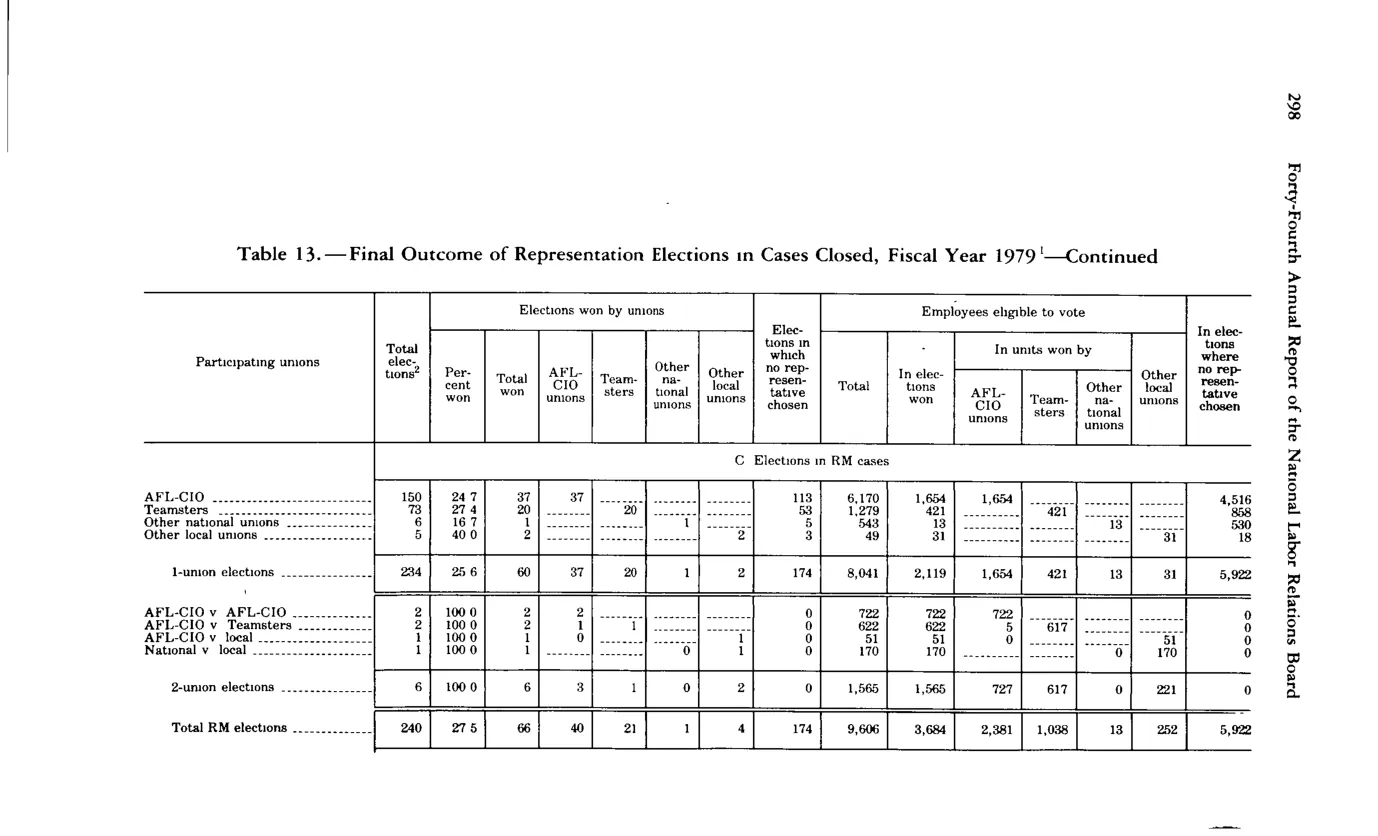
Final outcome of representation elections in cases closed (RM cases)
| Total elections | Percent won | Elections won by unions — Total | Elections won by unions — AFL-CIO unions | Elections won by unions — Teamsters | Elections won by unions — Other national unions | Elections won by unions — Other local unions | Elections in which no representative chosen | Employees eligible to vote — Total | Employees eligible to vote — In elections won by union | Employees eligible to vote — In units won by AFL-CIO | Employees eligible to vote — In units won by Teamsters | Employees eligible to vote — In units won by Other national | Employees eligible to vote — In units won by Other local | Employees eligible to vote — In elections where no representative chosen | |
|---|---|---|---|---|---|---|---|---|---|---|---|---|---|---|---|
| C. Elections in RM cases | |||||||||||||||
| AFL-CIO | 150 | 24.7 | 37 | 37 | 113 | 6,170 | 1,654 | 1,654 | 4,516 | ||||||
| Teamsters | 73 | 27.4 | 20 | 20 | 53 | 1,279 | 421 | 421 | 858 | ||||||
| Other national unions | 6 | 16.7 | 1 | 1 | 5 | 543 | 49 | 49 | 494 | ||||||
| Other local unions | 5 | 40 | 2 | 2 | 3 | 51 | 13 | 13 | 38 | ||||||
| 1-union elections (subtotal) | 234 | 25.6 | 60 | 37 | 20 | 1 | 2 | 174 | 8,041 | 2,119 | 1,654 | 421 | 49 | 13 | 5,922 |
| AFL-CIO + AFL-CIO | 2 | 100 | 2 | 2 | 722 | 722 | 722 | ||||||||
| AFL-CIO + Teamsters | 2 | 100 | 2 | 1 | 1 | 622 | 622 | 5 | 617 | ||||||
| AFL-CIO + local | 1 | 100 | 1 | 1 | 51 | 51 | 0 | 51 | |||||||
| National + local | 1 | 100 | 1 | 1 | 170 | 170 | 170 | ||||||||
| 2-union elections (subtotal) | 6 | 100 | 6 | 3 | 1 | 1 | 1 | 1,565 | 1,565 | 727 | 617 | 170 | 51 | ||
| Total RM elections | 240 | 27.5 | 66 | 40 | 21 | 2 | 4 | 174 | 9,606 | 3,684 | 2,381 | 1,038 | 219 | 64 | 5,922 |
Source image
Source data: U.S. NLRB Annual Reports (public domain). Reconstruction by NLRB Stats Archive. Updated June 2026.