NLRB Stats Archive › Annual Reports › FY1978 › Representation elections held in cases closed
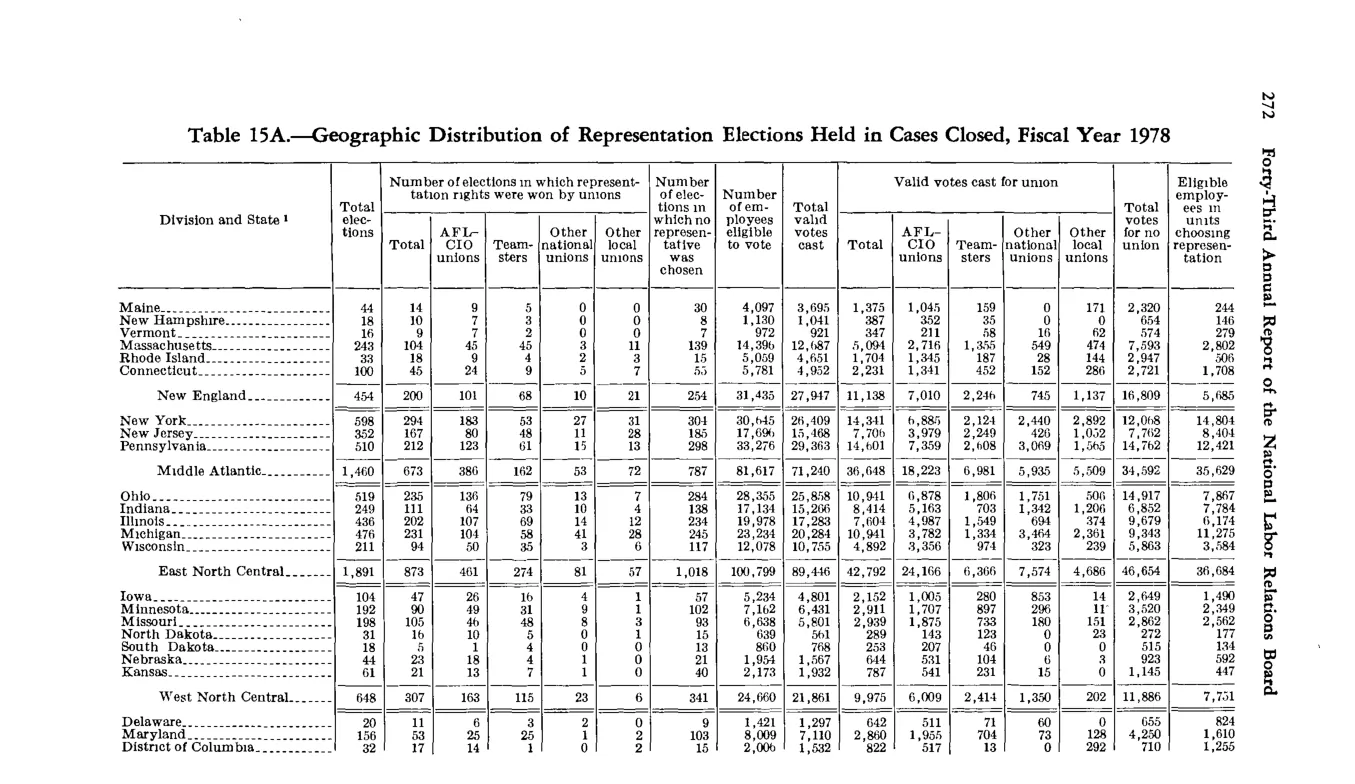
Representation elections held in cases closed
| Total elections | Number of elections in which representative was won by unions | Number of elections in which representative was won by unions | Number of elections in which representative was won by unions | Number of elections in which representative was won by unions | Number of elections in which representative was won by unions | Number of elections in which no representative was chosen | Number employees eligible to vote | Total valid votes cast | Valid votes cast for union | Valid votes cast for union | Valid votes cast for union | Valid votes cast for union | Valid votes cast for union | Eligible employees in elections in which no representative chosen | |
|---|---|---|---|---|---|---|---|---|---|---|---|---|---|---|---|
| Total elections | Total | AFL-CIO unions | Teamsters | Other national unions | Other local unions | Number of elections in which no representative was chosen | Number employees eligible to vote | Total valid votes cast | Total | AFL-CIO unions | Teamsters | Other national unions | Other local unions | Eligible employees in elections in which no representative chosen | |
| Maine | 44 | 14 | 7 | 3 | 3 | 1 | 30 | 4,097 | 3,005 | 1,375 | 1,045 | 159 | 2,320 | ||
| New England (division total) | 454 | 200 | 101 | 68 | 10 | 21 | 254 | 33,435 | 27,947 | 11,138 | 7,099 | 2,259 | 745 | 1,137 | 16,809 |
| Middle Atlantic (division total) | 1,440 | 672 | 390 | 162 | 53 | 72 | 765 | 83,417 | 71,260 | 26,684 | 18,222 | 4,961 | 1,295 | 2,200 | 34,140 |
| East North Central (division total) | 1,891 | 873 | 461 | 274 | 81 | 57 | 1,018 | 100,799 | 89,446 | 42,792 | 24,166 | 6,395 | 7,574 | 4,686 | 36,684 |
| West North Central (division total) | 648 | 307 | 163 | 115 | 23 | 9 | 341 | 24,460 | 21,891 | 9,571 | 5,069 | 2,411 | 1,350 | 302 | 8,734 |
Source image
Source data: U.S. NLRB Annual Reports (public domain). Reconstruction by NLRB Stats Archive. Updated June 2026.