NLRB Stats Archive › Annual Reports › FY1978 › Industrial distribution of cases received
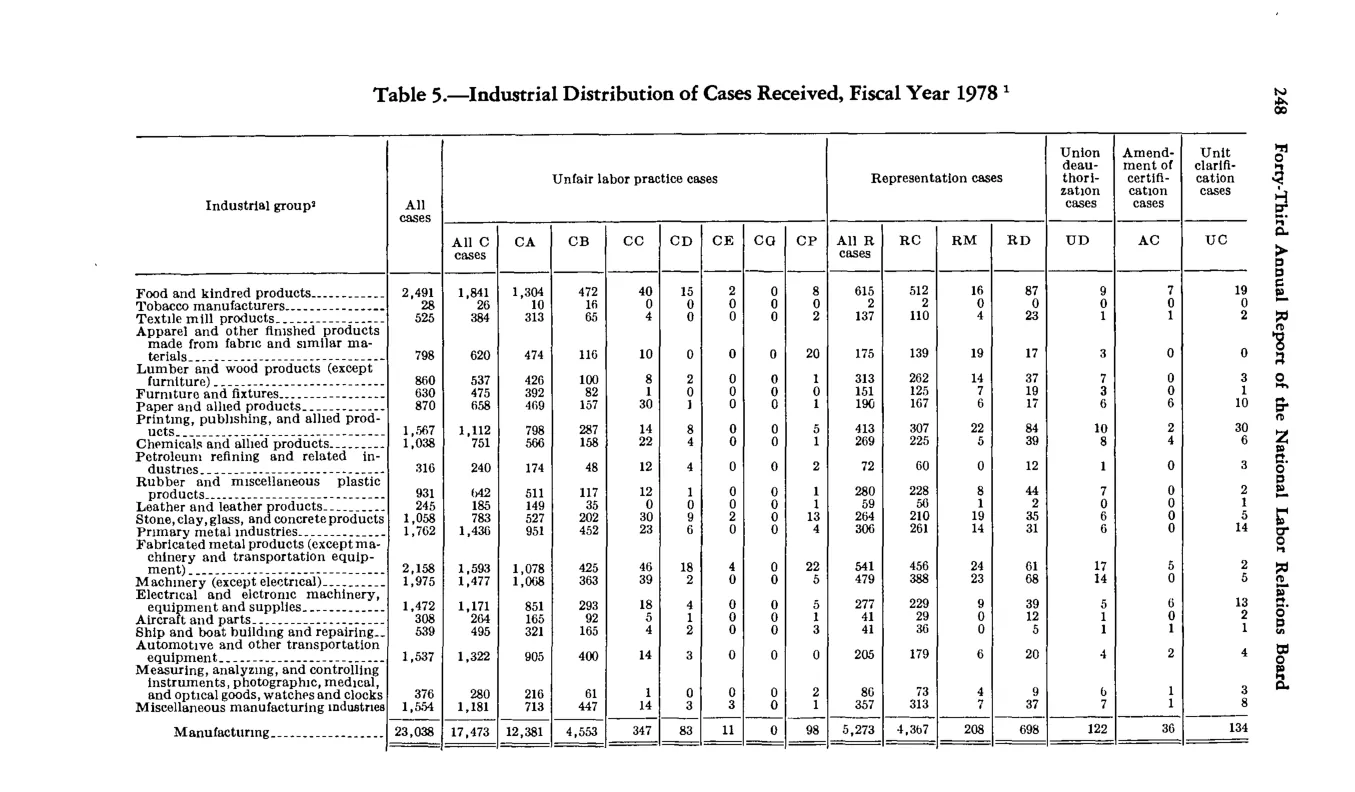
Industrial distribution of cases received
| Industrial group | All cases | Unfair labor practice cases | Unfair labor practice cases | Unfair labor practice cases | Unfair labor practice cases | Unfair labor practice cases | Unfair labor practice cases | Unfair labor practice cases | Unfair labor practice cases | Representation cases | Representation cases | Representation cases | Representation cases | Representation cases | Union deauthorization cases | Amendment of certification cases | |
|---|---|---|---|---|---|---|---|---|---|---|---|---|---|---|---|---|---|
| Industrial group | All cases | All C cases | CA | CB | CC | CD | CE | CG | CP | All R cases | RC | RM | RD | UD | AC | UC | |
| Food and kindred products | 2,491 | 1,861 | 1,304 | 172 | 40 | 15 | 2 | 0 | 6 | 625 | 512 | 16 | 57 | 3 | 2 | 19 | |
| Manufacturing (total) | 23,038 | 17,412 | 12,381 | 4,553 | 347 | 65 | 11 | 0 | 98 | 5,273 | 4,367 | 208 | 698 | 122 | 36 | 134 |
Source image
Source data: U.S. NLRB Annual Reports (public domain). Reconstruction by NLRB Stats Archive. Updated June 2026.