NLRB Stats Archive › Annual Reports › FY1976 › Industrial distribution of representation elections held in cases closed
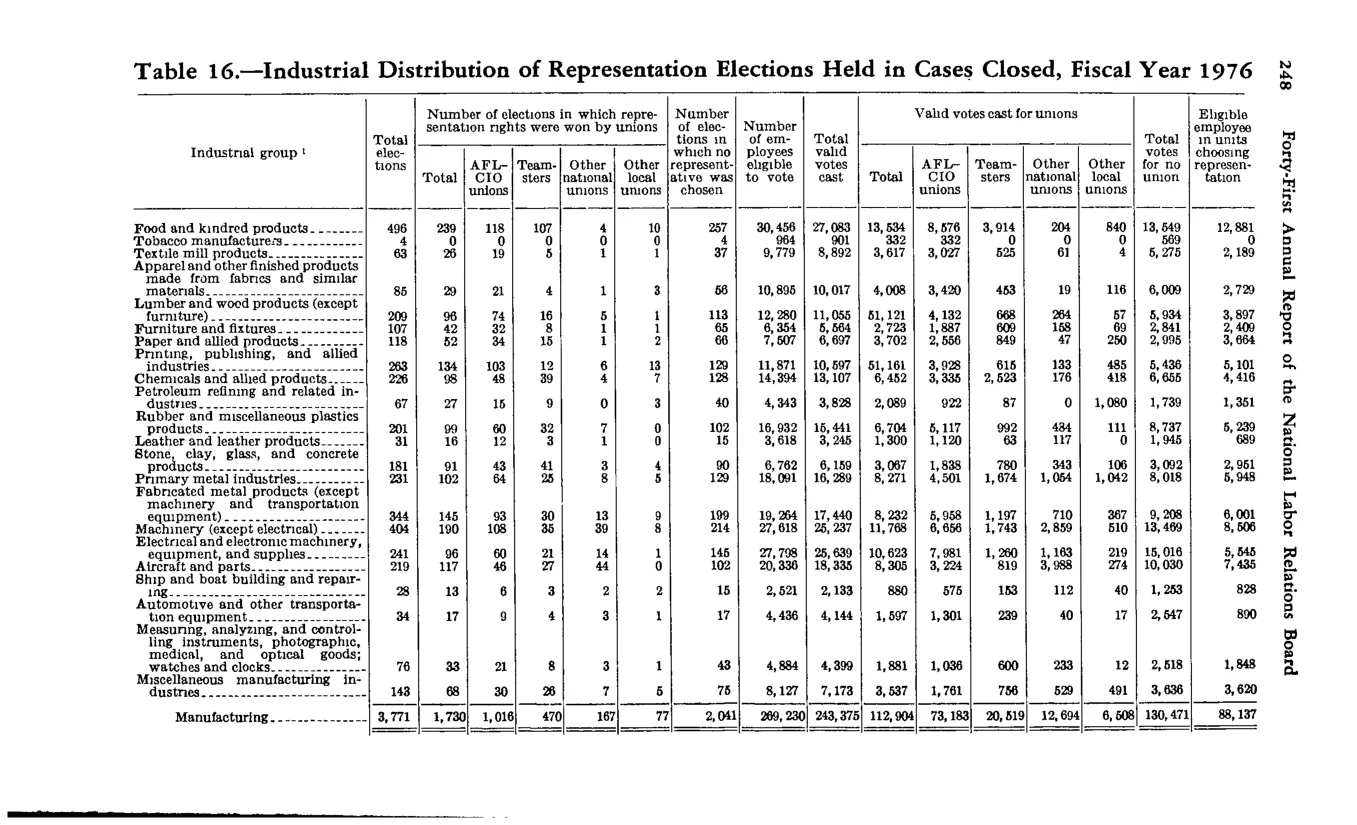
Industrial distribution of representation elections held in cases closed
| Industrial group | Total elections | Number of elections in which representation rights were won by unions | Number of elections in which representation rights were won by unions | Number of elections in which representation rights were won by unions | Number of elections in which representation rights were won by unions | Number of elections in which representation rights were won by unions | Number of elections in which no representative was chosen | Number of employees eligible to vote | Total valid votes cast | Valid votes cast for unions | Valid votes cast for unions | Valid votes cast for unions | Valid votes cast for unions | Valid votes cast for unions | Votes for no union | Eligible employees in units choosing representation | |
|---|---|---|---|---|---|---|---|---|---|---|---|---|---|---|---|---|---|
| Industrial group | Total elections | Total | AFL-CIO unions | Teamsters | Other national unions | Other local unions | Number of elections in which no representative was chosen | Number of employees eligible to vote | Total valid votes cast | Total | AFL-CIO unions | Teamsters | Other national unions | Other local unions | Votes for no union | Eligible employees in units choosing representation | |
| Manufacturing (total) | 3,771 | 1,730 | 1,016 | 470 | 167 | 77 | 2,041 | 269,330 | 243,375 | 112,904 | 73,183 | 20,519 | 10,494 | 8,708 | 130,471 | 98,127 | |
| Industry detail rows (Food and kindred products, Tobacco, Textile, Apparel, Lumber, Furniture, Paper, Printing, Chemicals, Petroleum, Rubber, Leather, Stone clay glass, Primary metal, Fabricated metal, Machinery, Electrical, Transportation eqpt, Aircraft, Ship/boat, Auto, Measuring instruments, Misc manufacturing) |
Source image
Source data: U.S. NLRB Annual Reports (public domain). Reconstruction by NLRB Stats Archive. Updated June 2026.