NLRB Stats Archive › Annual Reports › FY1976 › Standard federal administrative regional distribution of representation elections held in cases closed
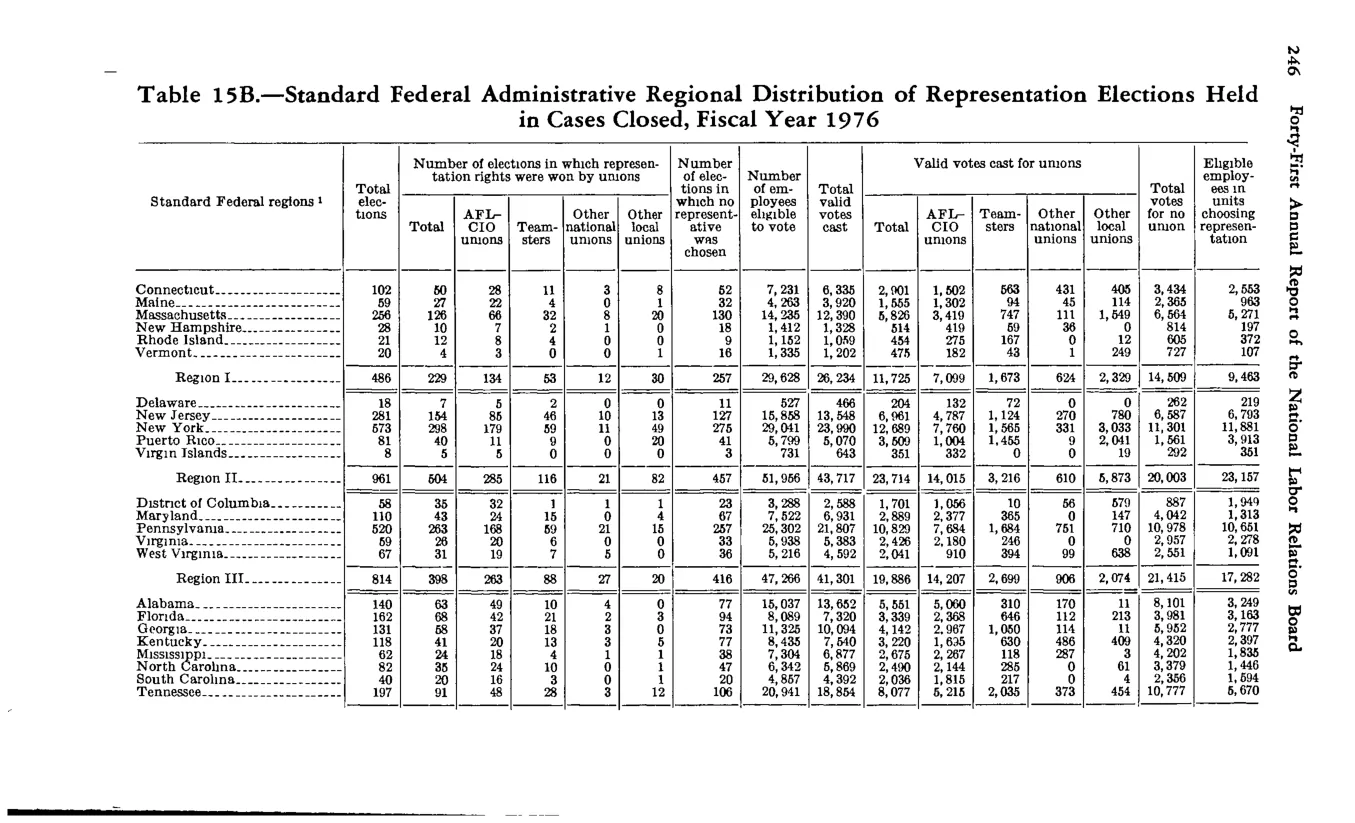
Standard federal administrative regional distribution of representation elections held in cases closed
| Standard Federal region | Total elections | Number of elections in which representation rights were won by unions | Number of elections in which representation rights were won by unions | Number of elections in which representation rights were won by unions | Number of elections in which representation rights were won by unions | Number of elections in which representation rights were won by unions | Number of elections in which no representative was chosen | Number of employees eligible to vote | Total valid votes cast | Valid votes cast for unions | Valid votes cast for unions | Valid votes cast for unions | Valid votes cast for unions | Valid votes cast for unions | Votes for no union | Eligible employees in units choosing representation |
|---|---|---|---|---|---|---|---|---|---|---|---|---|---|---|---|---|
| Standard Federal region | Total elections | Total | AFL-CIO unions | Teamsters | Other national unions | Other local unions | Number of elections in which no representative was chosen | Number of employees eligible to vote | Total valid votes cast | Total | AFL-CIO unions | Teamsters | Other national unions | Other local unions | Votes for no union | Eligible employees in units choosing representation |
| Region I | 486 | 229 | 134 | 53 | 10 | 32 | 257 | 29,628 | 26,194 | 11,725 | 7,099 | 1,673 | 624 | 2,329 | 14,509 | 9,468 |
| Region II | 961 | 504 | 320 | 108 | 22 | 57 | 457 | 51,195 | 43,717 | 20,003 | 14,015 | 3,216 | 910 | 5,873 | 20,003 | 33,187 |
| Region III | 814 | 398 | 263 | 98 | 12 | 25 | 416 | 47,266 | 41,301 | 16,886 | 14,207 | 2,690 | 808 | 2,074 | 21,415 | 17,393 |
| Individual state rows + further regions (Connecticut, Maine, Mass., NH, RI, VT, ...) |
Source image
Source data: U.S. NLRB Annual Reports (public domain). Reconstruction by NLRB Stats Archive. Updated June 2026.