NLRB Stats Archive › Annual Reports › FY1975 › Representation elections held in closed cases, by region
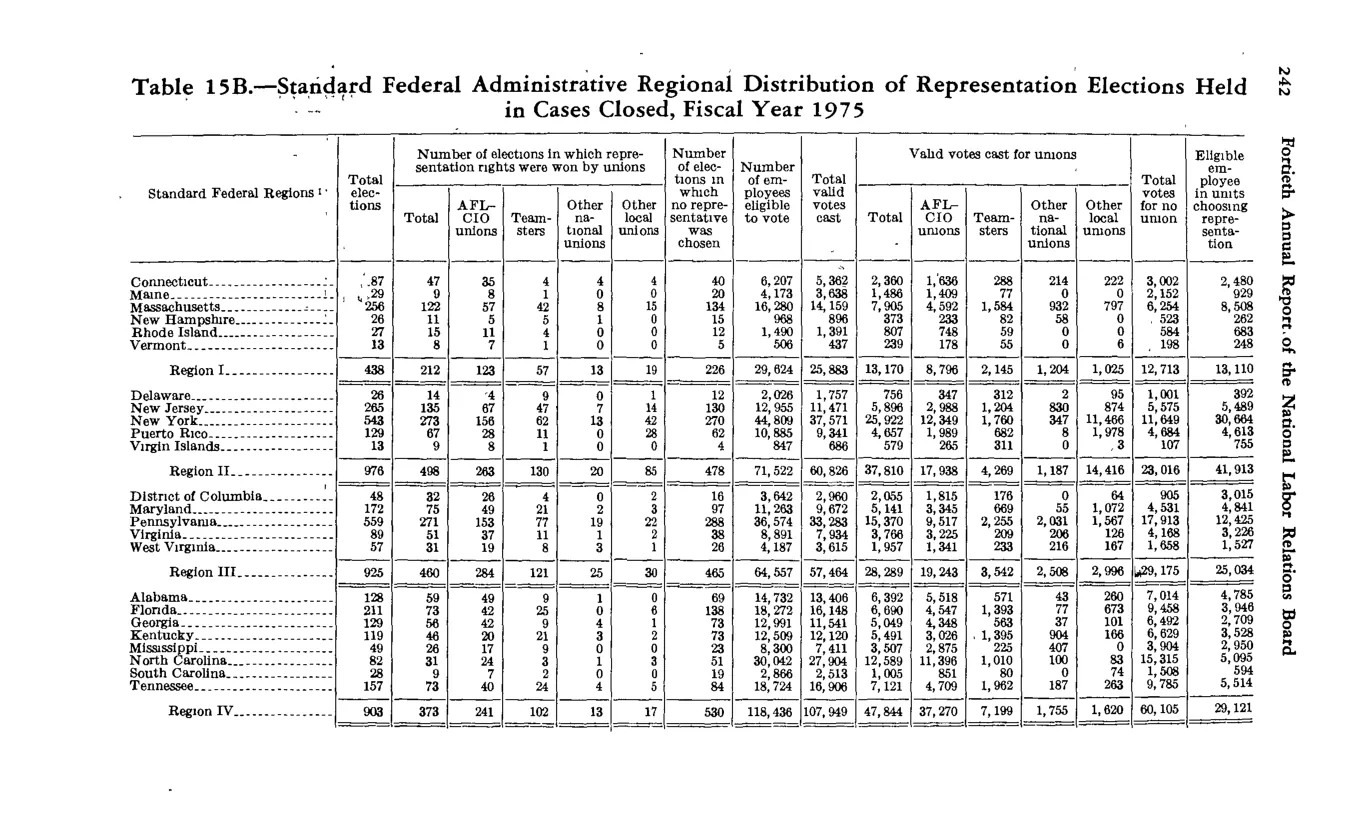
Representation elections held in closed cases, by region
| Standard Federal Regions | Total elections | Number of elections in which representation rights were won by unions | Number of elections in which representation rights were won by unions | Number of elections in which representation rights were won by unions | Number of elections in which representation rights were won by unions | Number of elections in which representation rights were won by unions | Number of elections in which no representation rights were won | Number of employees eligible to vote | Total valid votes cast | Valid votes cast for unions | Valid votes cast for unions | Valid votes cast for unions | Valid votes cast for unions | Valid votes cast for unions | Total votes for no union | Eligible employees in elections choosing representation | |
|---|---|---|---|---|---|---|---|---|---|---|---|---|---|---|---|---|---|
| Total | AFL-CIO unions | Teamsters | Other national unions | Other local unions | Total | AFL-CIO unions | Teamsters | Other national unions | Other local unions | ||||||||
| States in Region I (Connecticut, Maine, Massachusetts, New Hampshire, Rhode Island, Vermont) and per-state rows | |||||||||||||||||
| Region I | 438 | 212 | 153 | 37 | 13 | 19 | 226 | 29,624 | 25,883 | 13,170 | 8,796 | 2,145 | 1,204 | 1,025 | 12,713 | 13,110 | |
| States in Region II (Delaware, New Jersey, New York, Puerto Rico, Virgin Islands) and per-state rows | |||||||||||||||||
| Region II | 979 | 468 | 239 | 151 | 30 | 48 | 511 | 71,572 | 60,956 | 37,386 | 18,184 | 4,360 | 1,927 | 14,415 | 23,016 | 41,613 | |
| States in Region III (District of Columbia, Maryland, Pennsylvania, Virginia, West Virginia) and per-state rows | |||||||||||||||||
| Region III | 935 | 460 | 264 | 121 | 25 | 50 | 465 | 64,557 | 57,464 | 28,289 | 19,243 | 5,342 | 2,508 | 2,996 | 29,175 | 25,086 | |
| States in Region IV (Alabama, Florida, Georgia, Kentucky, Mississippi, North Carolina, South Carolina, Tennessee) and per-state rows | |||||||||||||||||
| Region IV | 903 | 373 | 241 | 102 | 13 | 17 | 530 | 116,436 | 107,949 | 47,844 | 37,270 | 7,199 | 1,755 | 1,620 | 60,105 | 29,121 |
Source image
Source data: U.S. NLRB Annual Reports (public domain). Reconstruction by NLRB Stats Archive. Updated June 2026.