NLRB Stats Archive › Annual Reports › FY1974 › Representation elections held in cases closed, by federal region
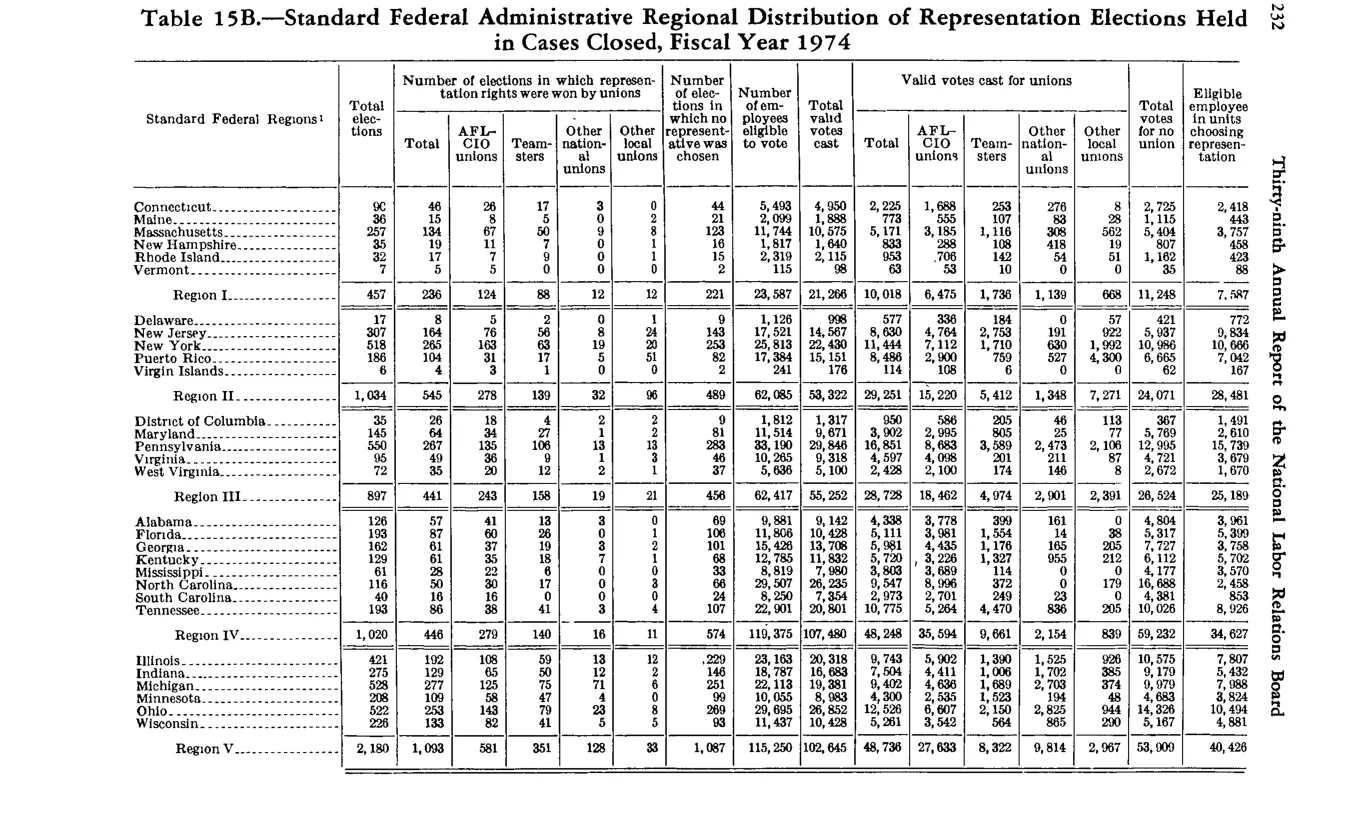
Representation elections held in cases closed, by federal region
| Standard Federal Regions | Total elections | Total with rep chosen | AFL-CIO unions | Teamsters | Other national unions | Other local unions | Number of employees eligible to vote | Total valid votes cast | Total valid for unions | AFL-CIO votes | Teamsters votes | Other national votes | Other local votes | Votes for no union | Eligible in choosing-rep units | |
|---|---|---|---|---|---|---|---|---|---|---|---|---|---|---|---|---|
| Region I (subtotal) | 457 | 236 | 124 | 88 | 12 | 12 | 221 | 23,587 | 21,266 | 10,018 | 6,475 | 1,736 | 1,139 | 668 | 11,248 | 7,138 |
| Per-state detail Region I (CT, ME, MA, NH, RI, VT) | ||||||||||||||||
| Region II (subtotal) | 1,034 | 540 | 278 | 169 | 37 | 56 | 494 | 85,581 | 15,225 | 1,848 | ||||||
| Per-state detail Region II (NJ, NY, PR, VI) | ||||||||||||||||
| Region III (subtotal) | 807 | 441 | 243 | 158 | 19 | 21 | 436 | 62,417 | 55,282 | 28,728 | 18,462 | 4,074 | 2,901 | 2,301 | 26,524 | 25,193 |
| Per-state detail Region III (DE, DC, MD, PA, VA, WV) | ||||||||||||||||
| Region IV (subtotal) | 1,020 | 446 | 279 | 140 | 19 | 8 | 574 | 115,375 | 107,496 | 48,248 | 33,594 | 9,661 | 2,154 | 839 | 59,232 | 34,627 |
| Per-state detail Region IV (AL, FL, GA, KY, MS, NC, SC, TN) | ||||||||||||||||
| Region V (subtotal) | 2,180 | 1,093 | 581 | 351 | 128 | 33 | 1,087 | 115,762 | 102,845 | 48,736 | 27,633 | 8,322 | 9,814 | 2,967 | 53,909 | 40,428 |
| Per-state detail Region V (IL, IN, MI, MN, OH, WI) |
Source image
Source data: U.S. NLRB Annual Reports (public domain). Reconstruction by NLRB Stats Archive. Updated June 2026.