NLRB Stats Archive › Annual Reports › FY1974 › Disposition of objections in representation cases closed
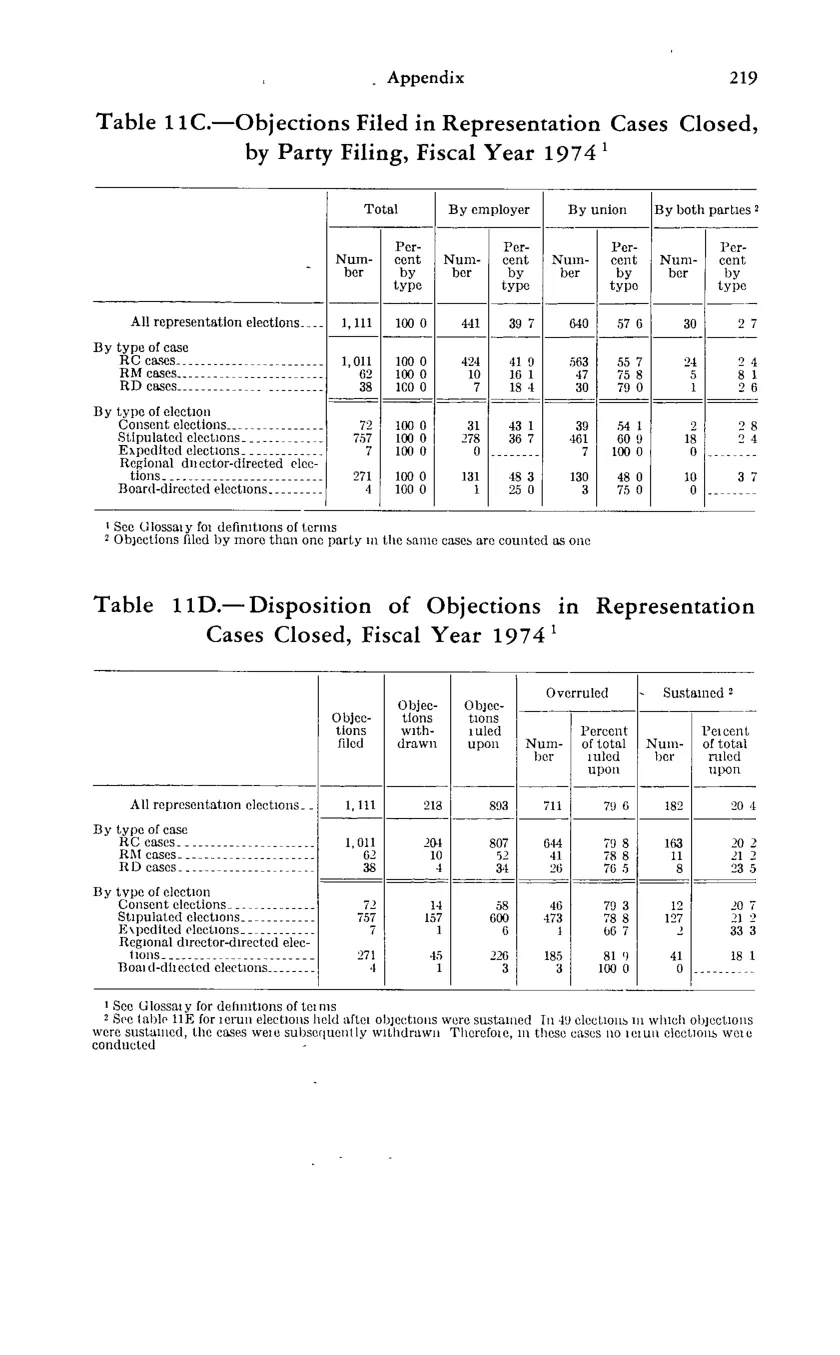
Disposition of objections in representation cases closed
| Objections filed | Objections withdrawn | Objections ruled upon | Overruled | Overruled | Sustained | Sustained | |
|---|---|---|---|---|---|---|---|
| Objections filed | Objections withdrawn | Objections ruled upon | Number | Percent of total ruled upon | Number | Percent of total ruled upon | |
| All representation elections | 1,111 | 218 | 893 | 711 | 79 6 | 182 | 20 4 |
| By type of case | |||||||
| RC cases | 1,011 | 204 | 807 | 644 | 79 8 | 163 | 20 2 |
| RM cases | 62 | 10 | 52 | 41 | 78 8 | 11 | 21 2 |
| RD cases | 38 | 4 | 34 | 26 | 76 5 | 8 | 23 5 |
| By type of election | |||||||
| Consent elections | 72 | 14 | 58 | 46 | 79 3 | 12 | 20 7 |
| Stipulated elections | 757 | 157 | 600 | 473 | 78 8 | 127 | 21 2 |
| Expedited elections | 7 | 1 | 6 | 1 | 66 7 | 2 | 33 3 |
| Regional director-directed elections | 271 | 45 | 226 | 185 | 81 9 | 41 | 18 1 |
| Board-directed elections | 4 | 1 | 3 | 3 | 100 0 | 0 |
Source image
Source data: U.S. NLRB Annual Reports (public domain). Reconstruction by NLRB Stats Archive. Updated June 2026.