NLRB Stats Archive › Annual Reports › FY1973 › Industrial distribution of representation elections held in cases closed
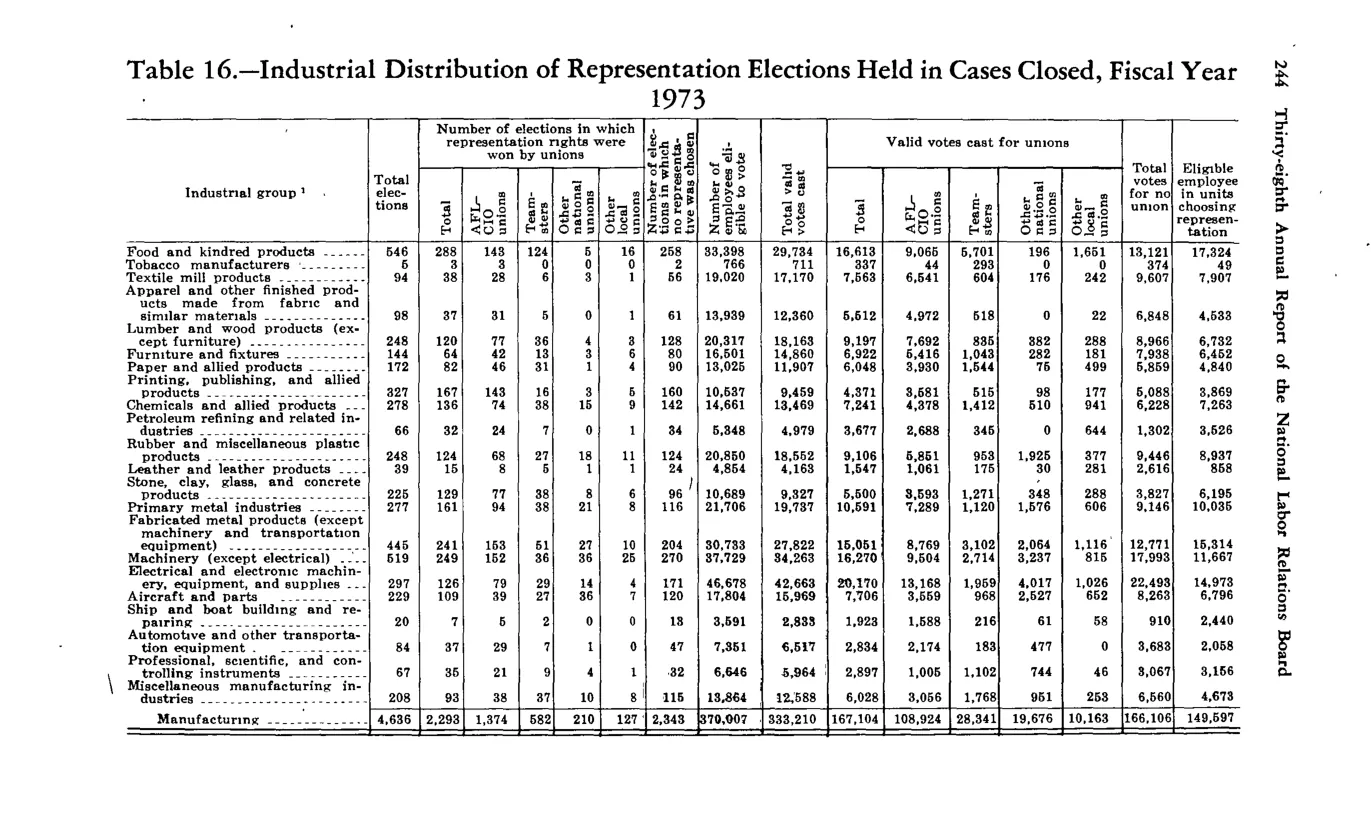
Industrial distribution of representation elections held in cases closed
| Industrial group | Total elections | Number of elections in which representation rights won by unions — Total | Number of elections in which representation rights won by unions — AFL-CIO | Number of elections in which representation rights won by unions — Teamsters | Number of elections in which representation rights won by unions — Other national | Number of elections in which representation rights won by unions — Other local | Number of elections in which no representative was chosen | Number of employees eligible to vote | Total valid votes cast | Valid votes cast for unions — Total | Valid votes cast for unions — AFL-CIO | Valid votes cast for unions — Teamsters | Valid votes cast for unions — Other national | Valid votes cast for unions — Other local | Total votes for no union | Eligible employees in units choosing representation |
|---|---|---|---|---|---|---|---|---|---|---|---|---|---|---|---|---|
| Food and kindred products | 546 | 288 | 143 | 124 | 5 | 16 | 258 | 33,396 | 29,724 | 16,613 | 9,065 | 5,701 | 196 | 1,651 | 13,111 | 17,324 |
| Tobacco manufactures | 5 | 3 | 2 | 1 | 0 | 0 | 2 | 766 | 711 | 337 | 44 | 293 | 0 | 0 | 374 | 374 |
| Textile mill products | 94 | 38 | 25 | 8 | 1 | 4 | 56 | 20,000 | 17,170 | 7,548 | 6,041 | 604 | 176 | 727 | 9,622 | 10,068 |
| Apparel and other finished products made from fabric and similar materials | 98 | 37 | 31 | 5 | 0 | 1 | 61 | 13,939 | 12,365 | 5,514 | 4,972 | 519 | 0 | 10 | 6,848 | 4,533 |
| Lumber and wood products (except furniture) | 248 | 120 | 77 | 36 | 4 | 3 | 128 | 20,317 | 18,163 | 9,197 | 7,492 | 885 | 382 | 388 | 8,966 | 6,732 |
| Furniture and fixtures | 144 | 64 | 42 | 13 | 3 | 6 | 80 | 16,581 | 14,260 | 6,922 | 6,416 | 1,043 | 282 | 181 | 7,936 | 6,432 |
| Paper and allied products | 172 | 85 | 53 | 24 | 4 | 1 | 90 | 12,023 | 10,775 | 5,037 | 3,808 | 1,032 | 168 | 0 | 5,738 | 5,859 |
| Printing, publishing, and allied industries | 327 | 167 | 63 | 39 | 16 | 9 | 162 | 10,855 | 9,459 | 4,373 | 3,621 | 515 | 98 | 177 | 5,088 | 3,869 |
| Chemicals and allied products | 278 | 138 | 74 | 38 | 16 | 9 | 144 | 16,663 | 14,452 | 7,241 | 4,378 | 1,412 | 510 | 941 | 6,228 | 7,263 |
| Manufacturing — Total | 4,636 | 2,293 | 1,374 | 582 | 210 | 127 | 2,343 | 379,097 | 333,210 | 167,104 | 108,924 | 28,341 | 19,676 | 10,163 | 166,106 | 149,597 |
Source image
Source data: U.S. NLRB Annual Reports (public domain). Reconstruction by NLRB Stats Archive. Updated June 2026.