NLRB Stats Archive › Annual Reports › FY1972 › Representation elections held in cases closed, by Federal administrative region
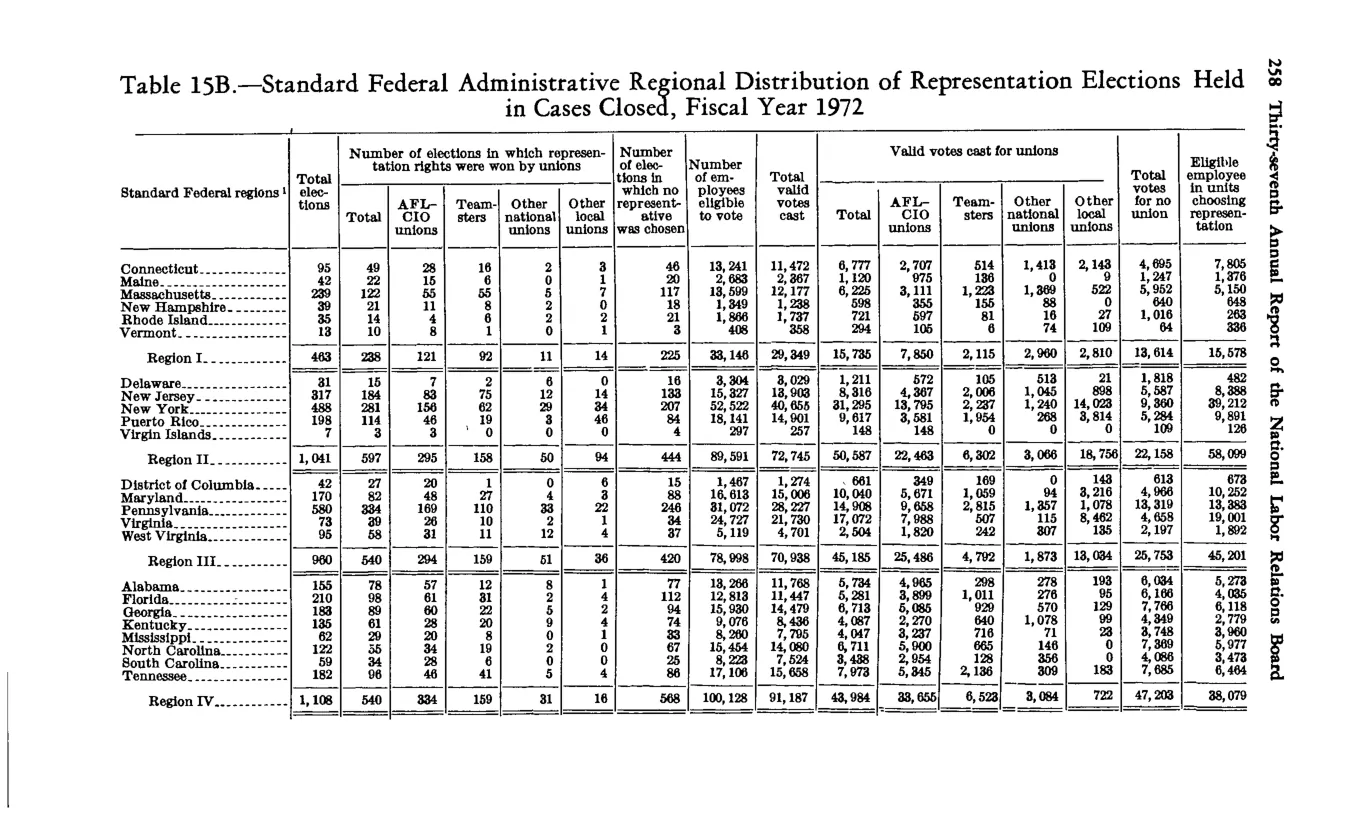
Representation elections held in cases closed, by Federal administrative region
| Standard Federal regions and States | Total elections | Total won | AFL-CIO unions | Teamsters | Other national unions | Other local unions | No representative chosen | Number of employees eligible to vote | Total valid votes cast | Total | AFL-CIO unions | Teamsters | Other national unions | Other local unions | Total votes for no union | Eligible employees in units choosing representation | |
|---|---|---|---|---|---|---|---|---|---|---|---|---|---|---|---|---|---|
| Region I | 463 | 238 | 121 | 92 | 11 | 14 | 225 | 39,146 | 29,349 | 15,795 | 7,850 | 2,115 | 2,960 | 3,030 | 13,614 | 13,316 | |
| Region II | 1,041 | 697 | 295 | 158 | 50 | 94 | 444 | 89,501 | 72,745 | 50,567 | 22,463 | 6,322 | 3,090 | 18,700 | |||
| Region III | 950 | 545 | 324 | 135 | 55 | 31 | 405 | 73,909 | 70,938 | 41,135 | 24,094 | 4,797 | 1,873 | 1,394 | 25,756 | 45,201 | |
| Region IV | 1,108 | 552 | 356 | 139 | 37 | 20 | 556 | 99,187 | 63,994 | 33,655 | 47,335 | 38,805 |
Source image
Source data: U.S. NLRB Annual Reports (public domain). Reconstruction by NLRB Stats Archive. Updated June 2026.