NLRB Stats Archive › Annual Reports › FY1972 › Elections in RM cases
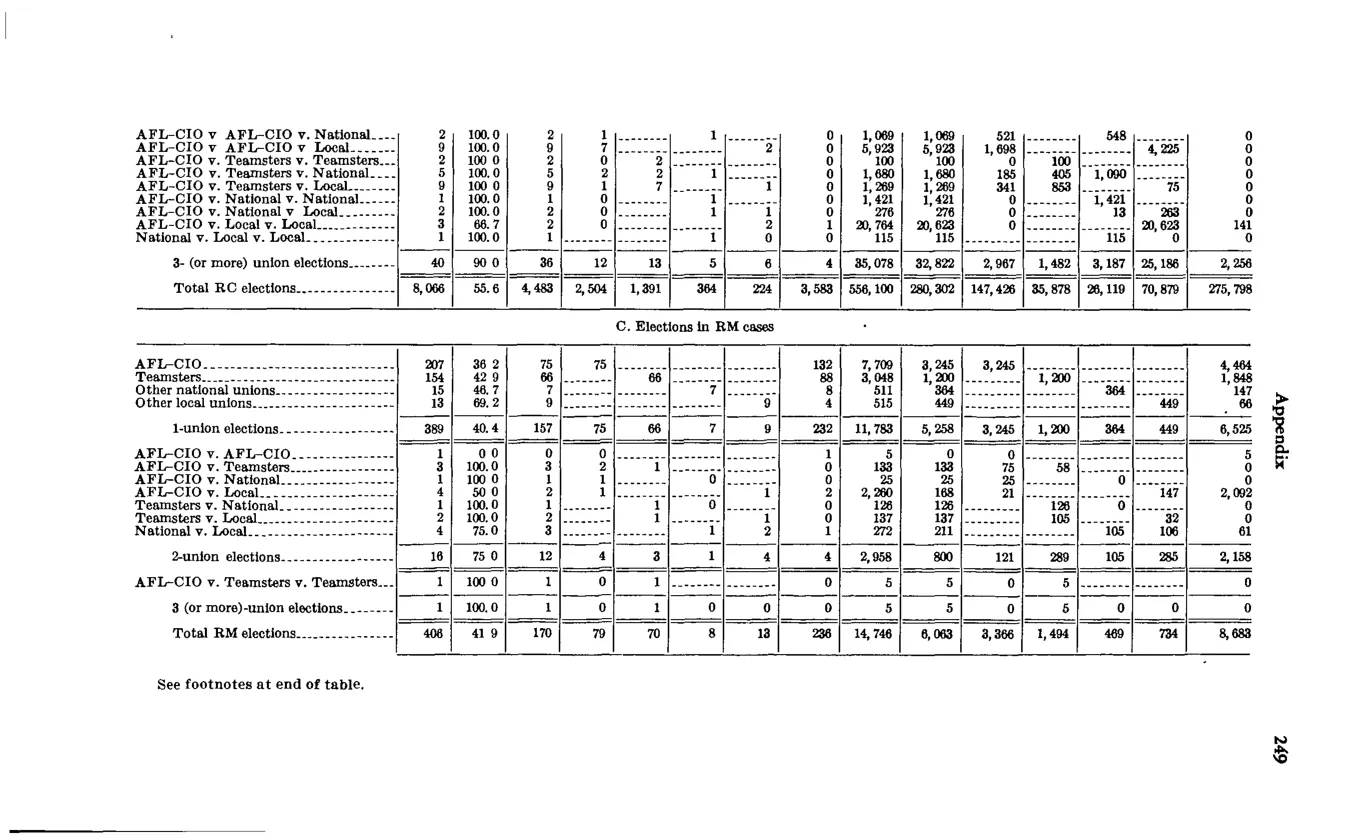
Elections in RM cases
| Participating unions | Total elections | Percent won | Total won | AFL-CIO unions | Teamsters | Other national unions | Other local unions | No representative chosen | Total eligible | AFL-CIO unions | Teamsters | AFL-CIO unions | Teamsters | Other national unions | No representative chosen | |
|---|---|---|---|---|---|---|---|---|---|---|---|---|---|---|---|---|
| 3 (or more)-union elections | 40 | 90 | 36 | 12 | 13 | 5 | 1 | 4 | 35,078 | 32,822 | 2,967 | 1,482 | 3,187 | 25,186 | 2,256 | |
| Total RC elections | 8,066 | 55.6 | 4,483 | 2,504 | 1,391 | 364 | 224 | 538,100 | 280,302 | 147,426 | 35,878 | 26,119 | 70,879 | 275,798 | ||
| Total RM elections | 406 | 41.9 | 170 | 79 | 70 | 8 | 13 | 236 | 14,746 | 8,053 | 3,866 | 1,404 | 469 | 724 | 6,693 |
Source image
Source data: U.S. NLRB Annual Reports (public domain). Reconstruction by NLRB Stats Archive. Updated June 2026.