NLRB Stats Archive › Annual Reports › FY1971 › Geographic distribution of representation elections held in cases closed
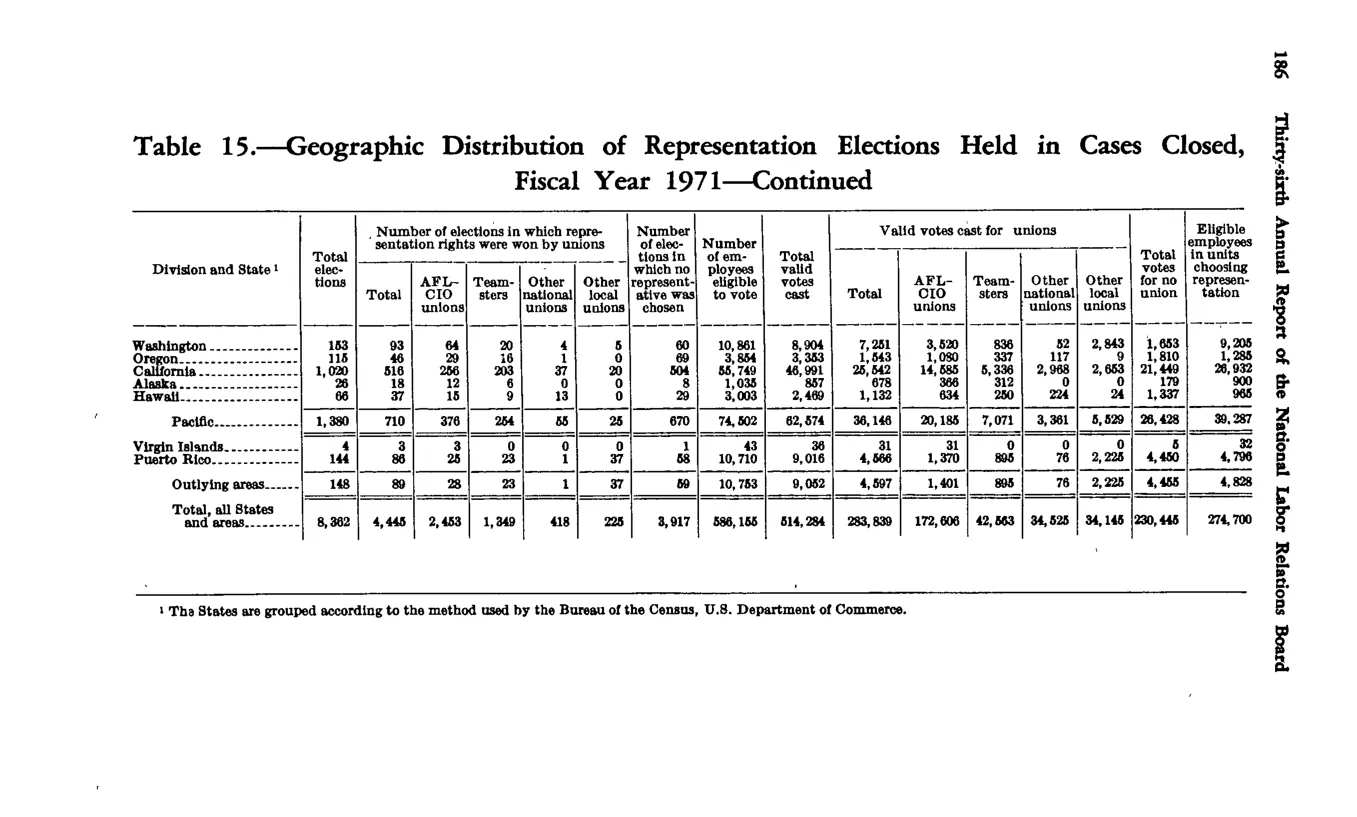
Geographic distribution of representation elections held in cases closed
| Division and State | Total elections held | Won by unions — Total | AFL-CIO | Teamsters | Other national | Other local | No representative | Number of employees eligible | Total valid votes cast | Valid votes cast for unions — Total | AFL-CIO | Teamsters | Other national | Other local | Total votes for no union | Eligible employees in units choosing representation |
|---|---|---|---|---|---|---|---|---|---|---|---|---|---|---|---|---|
| Pacific — Washington | 153 | 93 | 64 | 20 | 6 | 5 | 60 | 10,581 | 8,964 | 7,251 | 5,520 | 530 | 372 | 829 | 2,643 | 1,653 |
| Pacific — California | 1,020 | 516 | 226 | 263 | 23 | 4 | 504 | 65,141 | 50,419 | 24,800 | 16,346 | 5,556 | 2,330 | 568 | 25,619 | 11,801 |
| Pacific — Division total | 1,360 | 710 | 376 | 354 | 35 | 28 | 670 | 74,500 | 62,074 | 36,148 | 25,185 | 7,071 | 3,361 | 5,029 | 26,438 | 22,425 |
| Puerto Rico | 144 | 80 | 22 | 21 | 1 | 37 | 10,732 | 10,419 | 5,668 | 2,370 | 1,007 | 1,228 | 0 | 4,328 | 4,798 | |
| Outlying Areas — Total | 148 | 84 | 23 | 0 | 21 | 1 | 37 | 10,770 | 10,455 | 5,704 | 2,370 | 1,007 | 1,228 | 0 | 4,328 | 4,798 |
| Total, all States and areas | 8,362 | 4,445 | 2,453 | 1,349 | 418 | 225 | 3,917 | 596,135 | 514,294 | 253,520 | 172,606 | 42,363 | 34,533 | 34,148 | 230,445 | 274,790 |
Source image
Source data: U.S. NLRB Annual Reports (public domain). Reconstruction by NLRB Stats Archive. Updated June 2026.