NLRB Stats Archive › Annual Reports › FY1970 › Final outcome of representation elections in cases closed (RM cases)
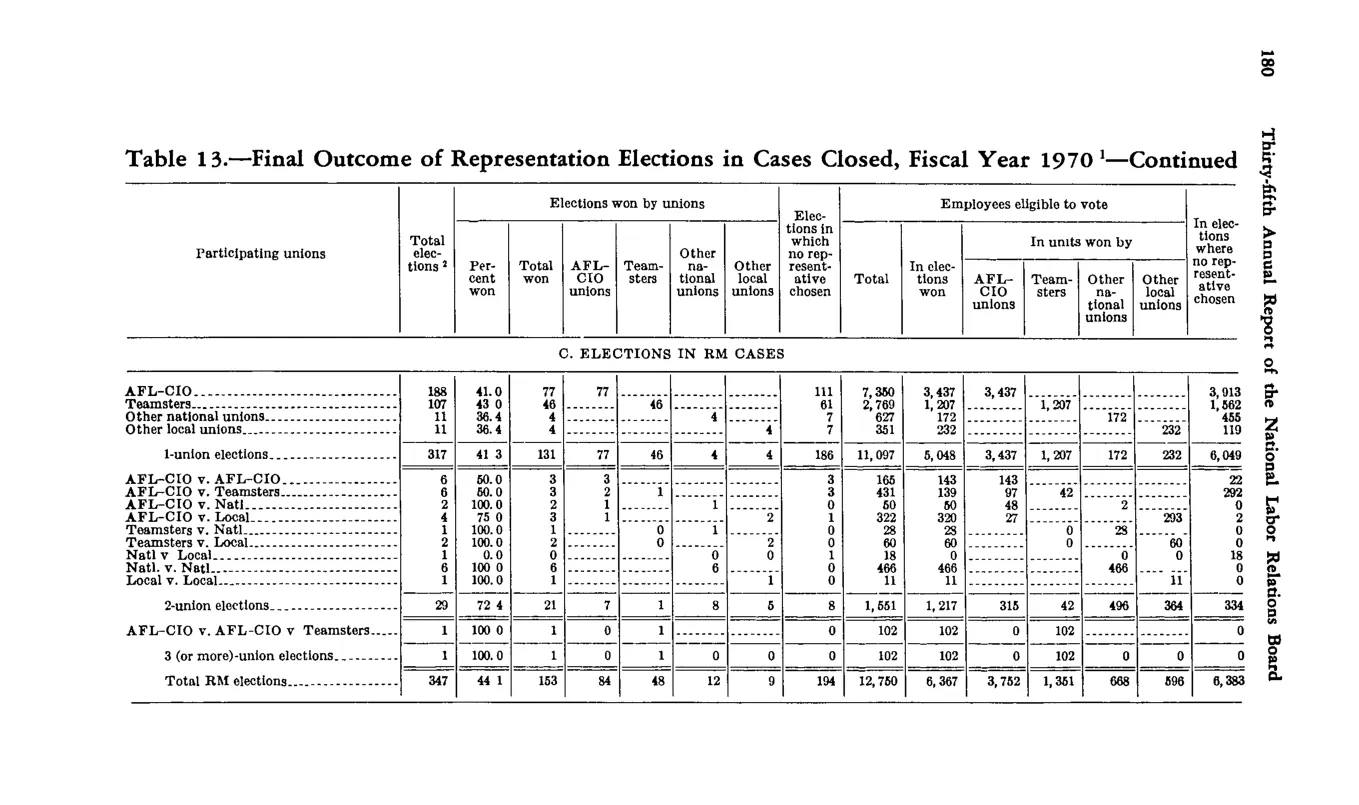
Final outcome of representation elections in cases closed (RM cases)
| Participating unions | Total elections | Percent won | Total won | Elections won by unions: AFL-CIO unions | Elections won by unions: Teamsters | Elections won by unions: Other national unions | Elections won by unions: Other local unions | Elections in which no representative chosen | Employees eligible to vote: Total | Employees eligible to vote: In elections won | Employees eligible to vote: In units won by AFL-CIO unions | Employees eligible to vote: In units won by Teamsters | Employees eligible to vote: In units won by Other national unions | Employees eligible to vote: In units won by Other local unions | Employees eligible to vote: In elections with no representative chosen |
|---|---|---|---|---|---|---|---|---|---|---|---|---|---|---|---|
| C. ELECTIONS IN RM CASES — AFL-CIO | 188 | 41 | 77 | 77 | 111 | 7,380 | 3,437 | 3,437 | 3,913 | ||||||
| Teamsters | 107 | 43 | 46 | 46 | 61 | 2,780 | 1,207 | 1,207 | 1,499 | ||||||
| Other national unions | 11 | 36.4 | 4 | 4 | 7 | 627 | 172 | 172 | 455 | ||||||
| Other local unions | 11 | 36.4 | 4 | 4 | 7 | 682 | 232 | 232 | 410 | ||||||
| 1-union elections subtotal (RM) | 317 | 41.3 | 131 | 77 | 46 | 4 | 4 | 186 | 11,097 | 5,048 | 3,437 | 1,207 | 172 | 232 | 6,049 |
| 2-union | |||||||||||||||
| 2-union elections subtotal (RM) | 29 | 72.4 | 21 | 8 | 6 | 4 | 4 | 8 | 1,551 | 1,217 | 315 | 42 | 495 | 364 | 334 |
| AFL-CIO v. AFL-CIO v. Teamsters | 1 | 100 | 1 | 1 | 0 | 102 | 102 | 102 | 0 | ||||||
| 3 (or more)-union elections subtotal (RM) | 1 | 100 | 1 | 1 | 0 | 0 | 0 | 0 | 102 | 102 | 102 | 0 | |||
| Total RM elections | 347 | 44.1 | 153 | 86 | 52 | 8 | 8 | 194 | 12,750 | 6,367 | 3,752 | 1,361 |
Source image
Source data: U.S. NLRB Annual Reports (public domain). Reconstruction by NLRB Stats Archive. Updated June 2026.