NLRB Stats Archive › Annual Reports › FY1967 › Size of units in representation election cases closed — certification elections (RC & RM)
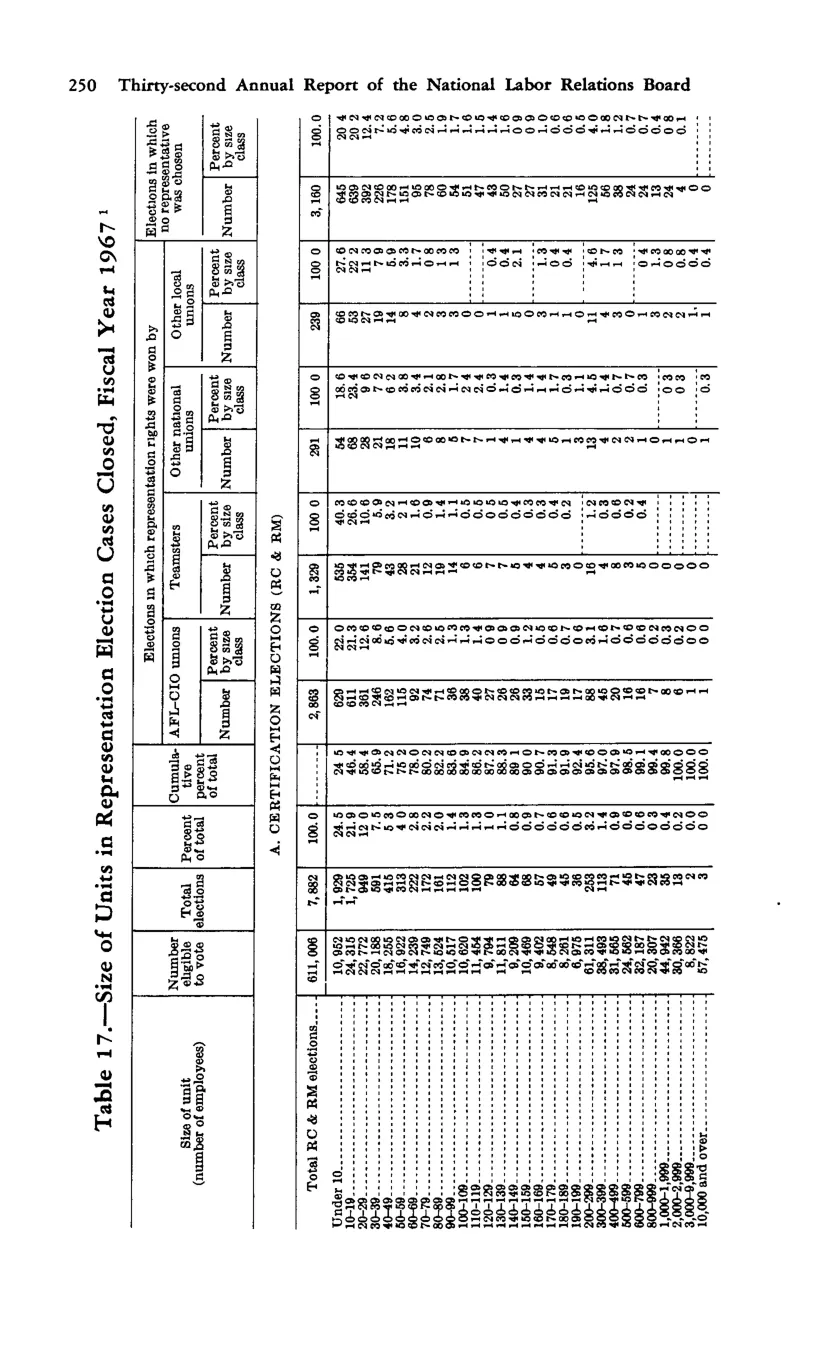
Size of units in representation election cases closed — certification elections (RC & RM)
| Size of unit (number of employees) | Number eligible to vote | Total elections — Number | Total elections — Percent of total | Cumulative percent of total | Elections won by unions — AFL-CIO — Number | Elections won by unions — AFL-CIO — Percent by size class | Elections won by unions — Teamsters — Number | Elections won by unions — Teamsters — Percent by size class | Elections won by unions — Other national unions — Number | Elections won by unions — Other national unions — Percent by size class | Elections won by unions — Other local unions — Number | Elections won by unions — Other local unions — Percent by size class | Elections in which no representative chosen — Number | Elections in which no representative chosen — Percent by size class | |
|---|---|---|---|---|---|---|---|---|---|---|---|---|---|---|---|
| Total RC & RM elections | 411,000 | 7,882 | 100 | 2,883 | 100 | 1,329 | 100 | 290 | 100 | 239 | 100 | 3,180 | 100 | ||
| Under 10 | 10,852 | 1,529 | 19.4 | 24.5 | 525 | 18.2 | 226 | 17 | 25 | 8.6 | 50 | 20.9 | 663 | 21.5 | |
| 10-19 | 13,232 | 989 | 12.5 | 37 | 421 | 14.6 | 80 | 6 | 31 | 10.7 | 44 | 18.4 | 408 | 12.8 | |
| 20-29 | 14,058 | 587 | 7.4 | 44.4 | 232 | 8 | 81 | 6.1 | 25 | 8.6 | 25 | 10.5 | 219 | 6.9 | |
| 200-249 | 40,123 | 178 | 2.3 | 76.8 | 88 | 3.1 | 17 | 1.3 | 6 | 2.1 | 6 | 2.5 | 67 | 2.1 | |
| 500-749 | 88,861 | 145 | 1.8 | 84.3 | 53 | 1.8 | 8 | 0.6 | 11 | 3.8 | 4 | 1.7 | 67 | 2.1 | |
| 1,000-1,499 | 51,406 | 41 | 0.5 | 85.3 | 16 | 0.6 | 1 | 0.1 | 5 | 1.7 | 1 | 0.4 | 22 | 0.7 | |
| 5,000-9,999 | 67,473 | 7 | 0.1 | 85.8 | 0 | 0 | 0 | 0 | 0 | 0 | 0 | 0 | 7 | 0.2 | |
| 10,000 and over | 0 | 0 | 0 | 85.8 |
Source image
Source data: U.S. NLRB Annual Reports (public domain). Reconstruction by NLRB Stats Archive. Updated June 2026.