NLRB Stats Archive › Annual Reports › FY1967 › Representation elections held in cases closed
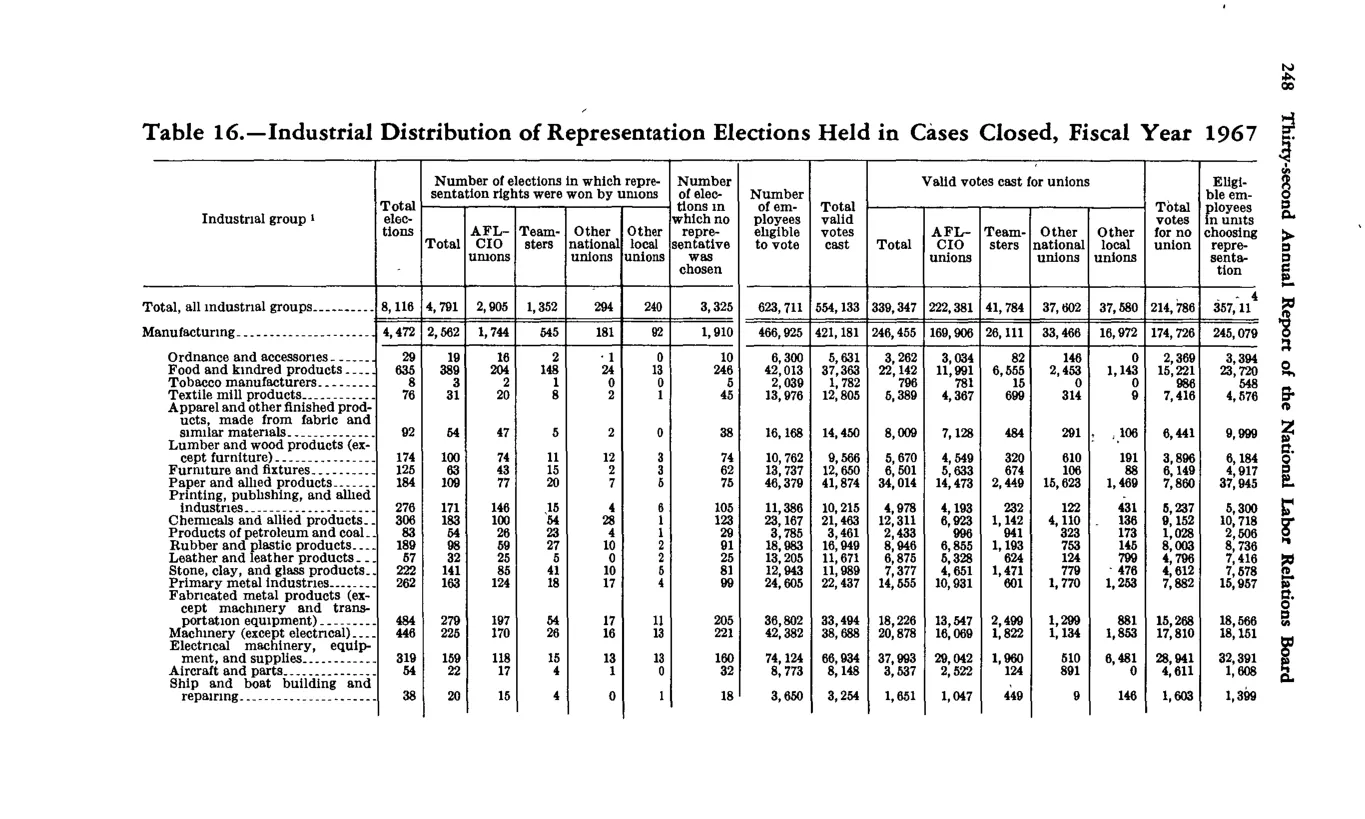
Representation elections held in cases closed
| Industrial group | Total elections held | Won by unions — Total | Won by unions — AFL-CIO | Won by unions — Teamsters | Won by unions — Other national unions | Won by unions — Other local unions | Number of elections in which no representative was chosen | Number of employees eligible | Total valid votes cast | Valid votes cast for unions — Total | Valid votes for unions — AFL-CIO | Valid votes for unions — Teamsters | Valid votes for unions — Other national unions | Valid votes for unions — Other local unions | Total votes for no union | Eligible employees in units choosing union |
|---|---|---|---|---|---|---|---|---|---|---|---|---|---|---|---|---|
| Total, all industrial groups | 8,116 | 4,791 | 2,905 | 833 | 294 | 240 | 3,325 | 623,711 | 554,133 | 339,347 | 222,381 | 41,784 | 37,602 | 37,580 | 214,786 | 357,114 |
| Manufacturing | 4,472 | 2,562 | 1,744 | 343 | 181 | 92 | 1,910 | 466,925 | 421,181 | 245,455 | 169,906 | 26,113 | 33,469 | 16,872 | 174,726 | |
| Ordnance and accessories | 29 | 19 | 15 | 4 | 0 | 0 | 10 | 6,300 | 5,331 | |||||||
| Food and kindred products | 635 | 380 | 204 | 142 | 24 | 10 | 247 | 31,460 | 29,442 | |||||||
| Machinery (except electrical) | 460 | 226 | 124 | 36 | 23 | 14 | 224 | |||||||||
| Electrical machinery, equipment, and supplies | 319 | 159 | 88 | 39 | 13 | 6 | 160 | 75,124 | ||||||||
| Transportation equipment | 263 | 156 | 84 | 30 | 17 | 22 | 109 | 44,683 | ||||||||
| Primary metal industries | 234 | 153 | 87 | 38 | 16 | 2 | 81 | 26,884 | ||||||||
| Chemicals and allied products | 306 | 163 | 100 | 41 | 14 | 0 | 137 | 23,167 | ||||||||
| Fabricated metal products (except machinery and transportation equipment) | 384 | 279 | 154 | 71 | 41 | 11 | 105 | 30,802 |
Source image
Source data: U.S. NLRB Annual Reports (public domain). Reconstruction by NLRB Stats Archive. Updated June 2026.