NLRB Stats Archive › Annual Reports › FY1967 › Representation elections held in cases closed — by State
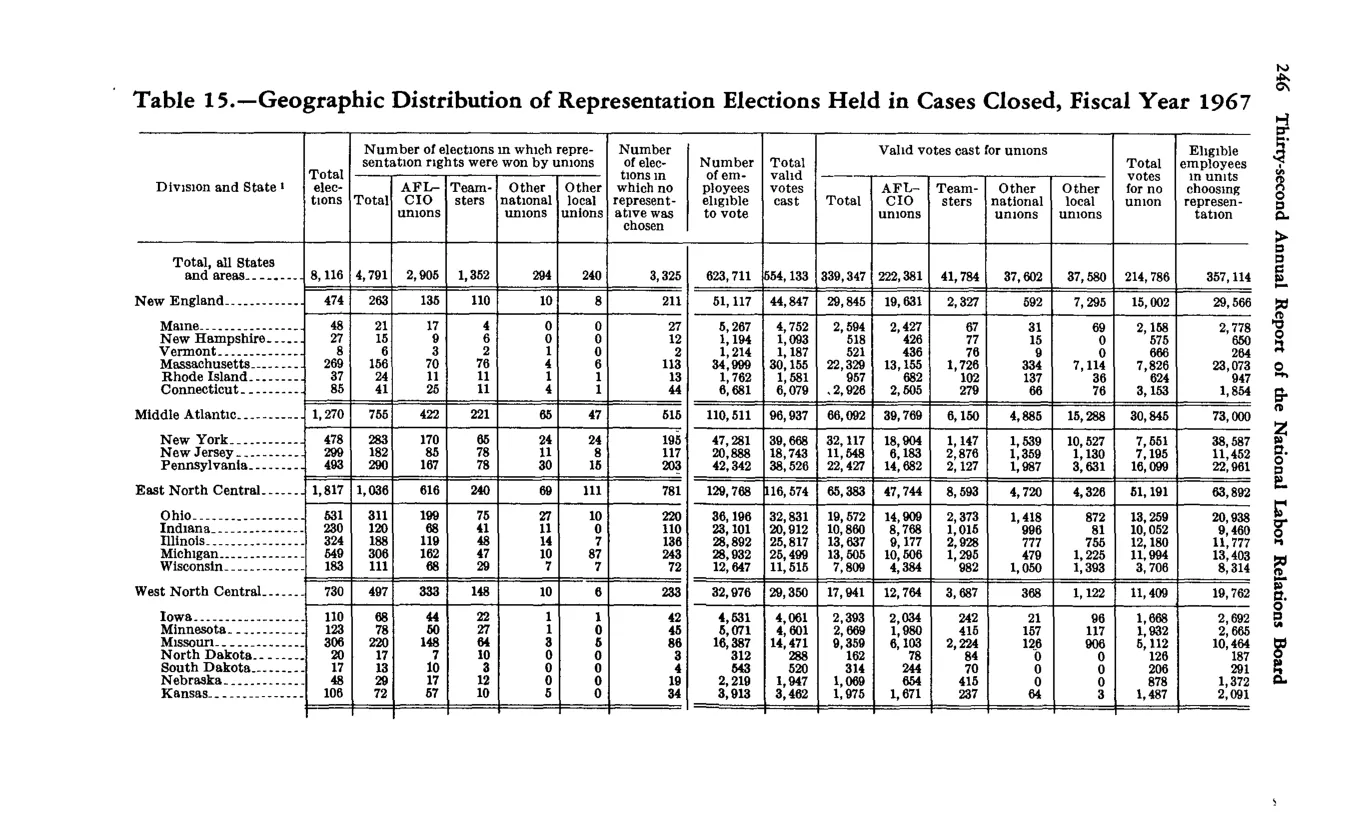
Representation elections held in cases closed — by State
| Division and State | Total elections held | Number of representation elections in which won by unions — Total | Won by unions — AFL-CIO | Won by unions — Teamsters | Won by unions — Other national unions | Won by unions — Other local unions | Number of elections in which no representative was chosen | Number of employees eligible | Total valid votes cast | Valid votes cast for unions — Total | Valid votes for unions — AFL-CIO | Valid votes for unions — Teamsters | Valid votes for unions — Other national unions | Valid votes for unions — Other local unions | Total votes for no union | Eligible employees in units choosing union |
|---|---|---|---|---|---|---|---|---|---|---|---|---|---|---|---|---|
| Total, all States and areas | 8,116 | 4,791 | 2,905 | 833 | 294 | 240 | 3,325 | 623,711 | 554,133 | 339,347 | 222,381 | 41,784 | 37,602 | 37,580 | 214,786 | 357,114 |
| New England | 474 | 263 | 135 | 110 | 10 | 8 | 211 | 51,117 | 44,847 | 29,945 | 19,631 | 2,327 | 502 | 7,295 | 15,002 | 29,566 |
| Middle Atlantic | 1,270 | 755 | 422 | 224 | 65 | 47 | 515 | 110,511 | 99,687 | 66,092 | 39,789 | 6,154 | 4,883 | 15,239 | 30,843 | |
| East North Central | 1,817 | 1,036 | 616 | 240 | 60 | 111 | 781 | 129,766 | 101,374 | 65,381 | 47,766 | 8,560 | 4,720 | 4,331 | 51,191 | 63,892 |
| West North Central | 730 | 467 | 333 | 109 | 7 | 21 | 261 | 32,976 | 29,533 | 17,841 | 12,734 | 3,827 | 358 | 1,122 | 11,419 | 16,732 |
Source image
Source data: U.S. NLRB Annual Reports (public domain). Reconstruction by NLRB Stats Archive. Updated June 2026.