NLRB Stats Archive › Annual Reports › FY1966 › Representation elections held in cases closed
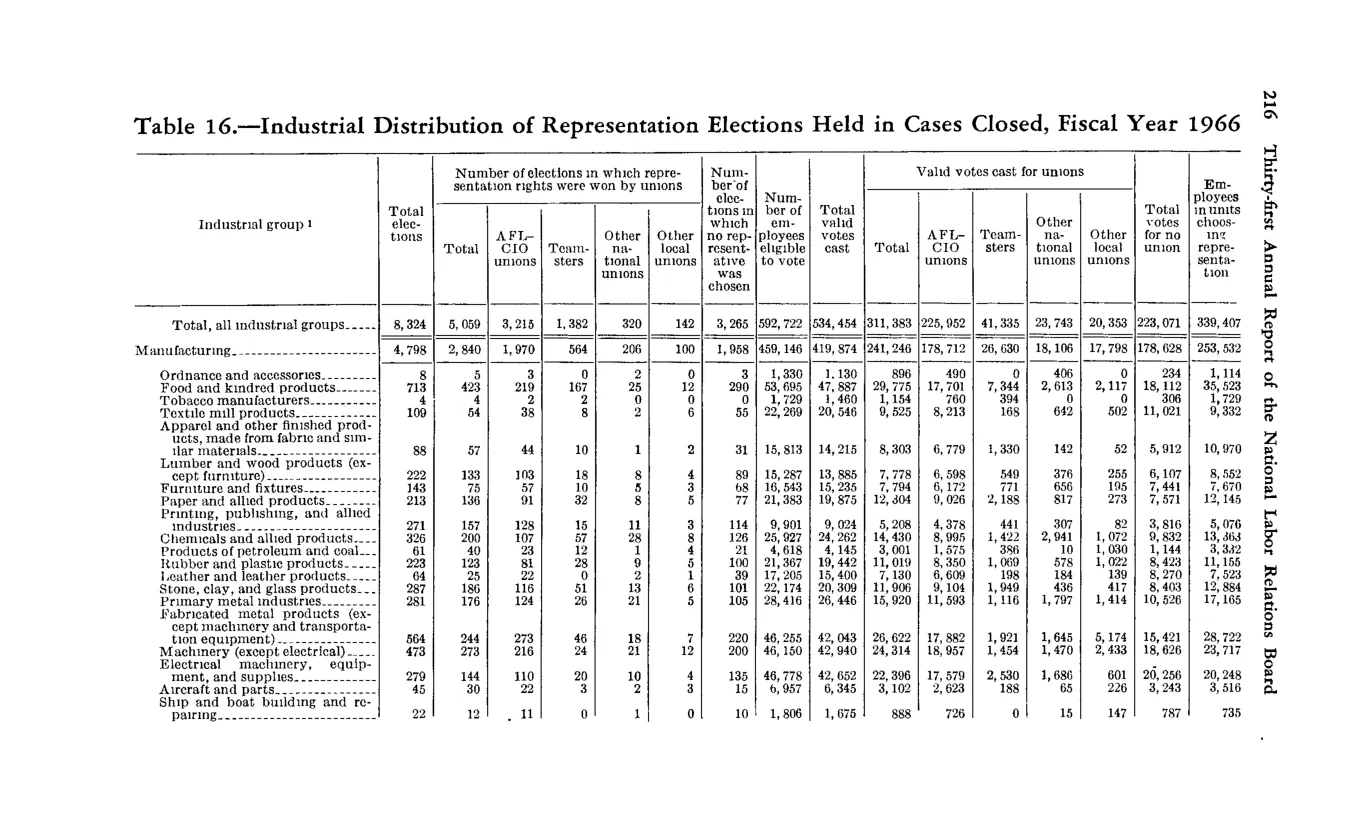
Representation elections held in cases closed
| Industrial group | Total elections | Number of elections in which representation rights were won by unions Total | AFL-CIO unions | Teamsters | Other national unions | Other local unions | Number of elections in which no representative was chosen | Number of employees eligible to vote | Total valid votes cast | Valid votes cast for unions Total | AFL-CIO unions | Teamsters | Other national unions | Other local unions | Valid votes for no union | Employees in elections choosing representation | |
|---|---|---|---|---|---|---|---|---|---|---|---|---|---|---|---|---|---|
| Total, all industrial groups | 8,324 | 5,059 | 3,215 | 1,382 | 320 | 142 | 3,265 | 592,742 | 419,874 | 311,353 | 225,932 | 41,335 | 23,743 | 20,333 | 176,628 | 339,532 | |
| Manufacturing (subtotal) | 4,796 | 2,840 | 1,970 | 504 | 206 | 100 | 1,955 | 459,002 | 382,160 | 241,046 | 176,733 | 32,932 | 18,135 | 20,353 | 178,628 | 153,634 | |
| Manufacturing sub-industries (Ordnance/accessories / Food/kindred / Tobacco / Textile / Apparel / Lumber / Furniture / Paper / Printing / Chemicals / Petroleum / Rubber / Leather / Stone-clay-glass / Primary metal / Fabricated metal / Machinery / Electrical / Transportation / Aircraft / Ship/boat / Automotive / Professional/scientific / Miscellaneous) |
Source image
Source data: U.S. NLRB Annual Reports (public domain). Reconstruction by NLRB Stats Archive. Updated June 2026.