NLRB Stats Archive › Annual Reports › FY1966 › Final outcome of representation elections in cases closed — RM cases
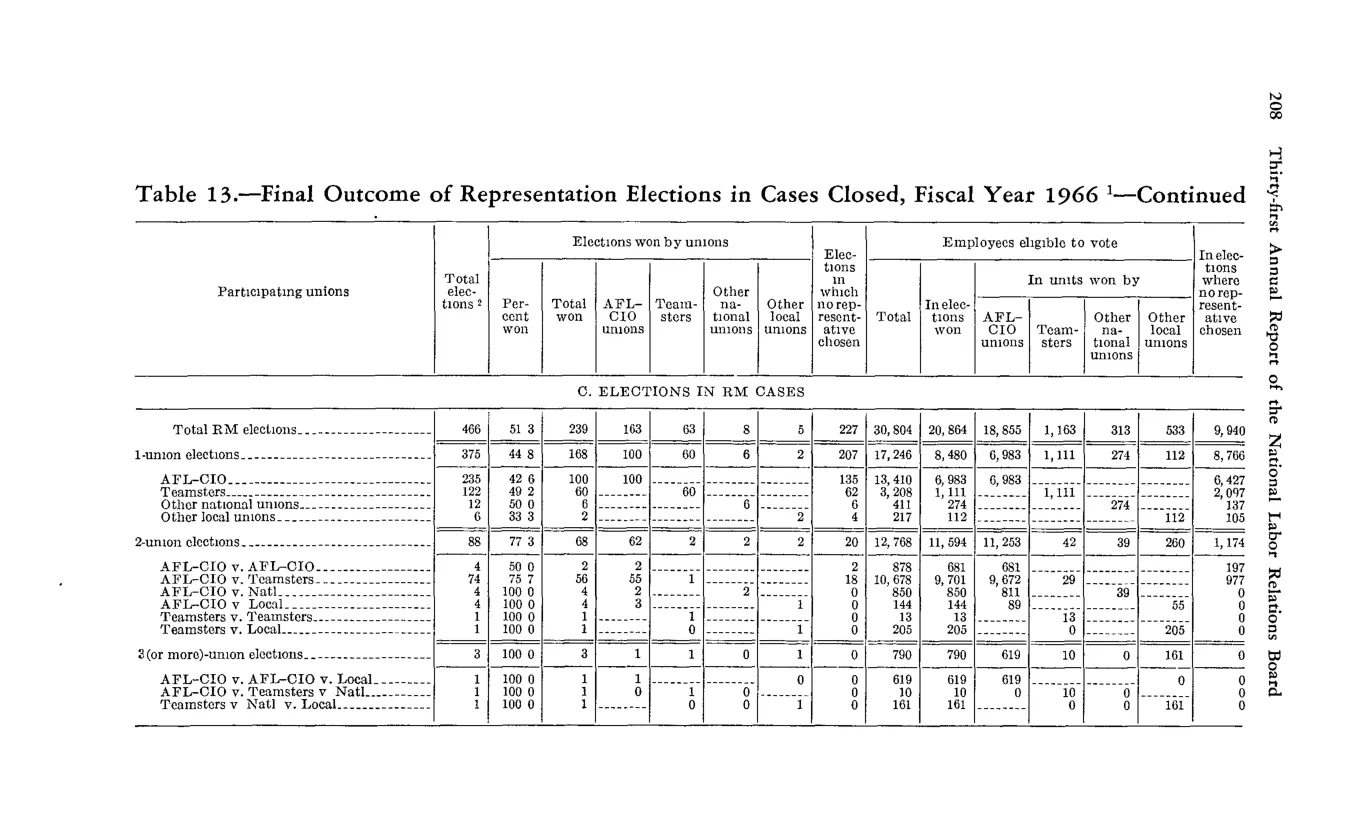
Final outcome of representation elections in cases closed — RM cases
| Participating unions | Total elections | Elections won by unions Percent won | Elections won by unions Total won | Elections won by AFL-CIO | Elections won by Teamsters | Elections won by Other national | Elections won by Other local | Elections in which | Employees eligible to vote Total | Employees eligible to vote in election won by AFL-CIO | Employees eligible to vote in election won by Teamsters | Employees eligible to vote in election won by Other national | Employees eligible to vote in election won by Other local | Employees eligible to vote in elections where | |
|---|---|---|---|---|---|---|---|---|---|---|---|---|---|---|---|
| C. ELECTIONS IN RM CASES — section header | |||||||||||||||
| Total RM elections | 466 | 51.3 | 239 | 153 | 63 | 8 | 5 | 227 | 30,850 | 20,664 | 18,853 | 1,163 | 313 | 533 | 9,940 |
| 1-union elections (subtotal) | 375 | 44.8 | 168 | 108 | 53 | 3 | 4 | 207 | 17,746 | 8,480 | 6,983 | 1,111 | 274 | 112 | 8,766 |
| 1-union election affiliation | |||||||||||||||
| 2-union elections (subtotal) | 88 | 77.3 | 68 | 62 | 2 | 2 | 2 | 20 | 12,768 | 11,594 | 11,253 | 42 | 39 | 1,174 | |
| 2-union affiliation-pair | |||||||||||||||
| 3 (or more)-union elections (subtotal) | 3 | 100 | 3 | 3 | 790 | 790 | 619 | 163 |
Source image
Source data: U.S. NLRB Annual Reports (public domain). Reconstruction by NLRB Stats Archive. Updated June 2026.