NLRB Stats Archive › Annual Reports › FY1965 › Representation elections held in cases closed
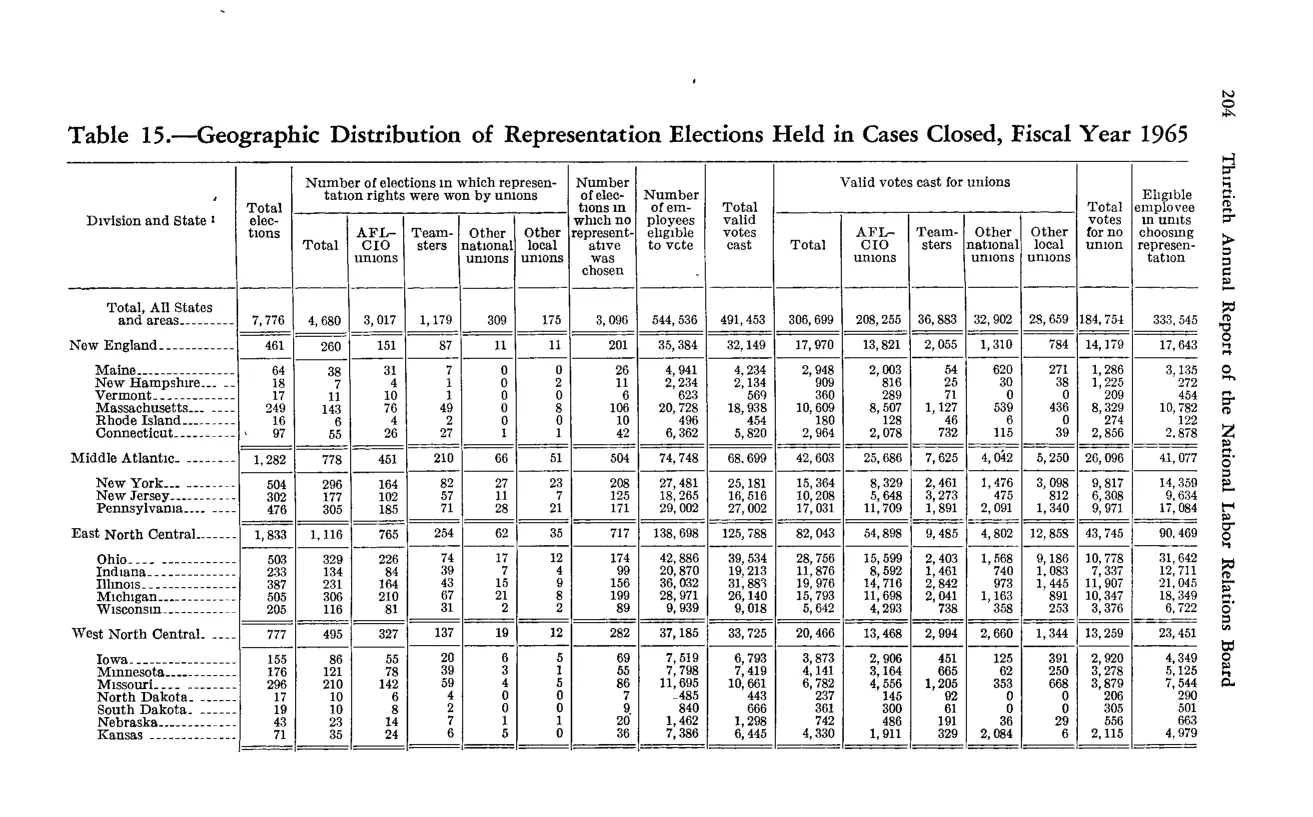
Representation elections held in cases closed
| Division and State | Total elections | Elections won by unions: Total | AFL-CIO unions | Teamsters | Other national | Other local | Other(?) | Total eligible | Total valid votes cast | Votes for unions Total | AFL-CIO | Teamsters | Other national | Other local | Votes for no union | Eligible employees in units choosing representation | |
|---|---|---|---|---|---|---|---|---|---|---|---|---|---|---|---|---|---|
| Total, All States and areas | 7,776 | 4,680 | 3,017 | 1,179 | 309 | 173 | 5 | 3,096 | 544,538 | 491,453 | 395,609 | 226,235 | 36,883 | 32,902 | 29,459 | 184,734 | 333,545 |
| New England (division subtotal) | 461 | 288 | 175 | 78 | 11 | 24 | 173 | 35,384 | 32,194 | 17,970 | 13,821 | 2,055 | 1,310 | 784 | 14,179 | 17,643 | |
| New England states (Maine, New Hampshire, Vermont, Massachusetts, Rhode Island, Connecticut) | |||||||||||||||||
| Middle Atlantic (division subtotal) | 1,282 | 779 | 596 | 162 | 82 | 27 | 504 | 74,748 | 68,690 | 42,003 | 23,686 | 7,623 | 6,042 | 5,230 | 20,096 | 41,077 | |
| Middle Atlantic states (New York 506/...; New Jersey 302/...; Pennsylvania 474/...) | |||||||||||||||||
| East North Central (division subtotal) | 1,833 | 1,196 | 763 | 304 | 62 | 33 | 734 | 139,108 | 125,338 | 82,053 | 54,835 | 9,683 | 9,186 | 9,562 | 43,278 | 90,049 | |
| East North Central states (Ohio, Indiana, Illinois, Michigan, Wisconsin) | |||||||||||||||||
| West North Central (division subtotal) | 777 | 495 | 327 | 137 | 19 | 12 | 282 | 37,182 | 33,725 | 20,946 | 15,468 | 2,904 | 2,660 | 1,344 | 10,909 | 23,443 | |
| West North Central states (Iowa, Minnesota, Missouri, North Dakota, South Dakota, Nebraska, Kansas) |
Source image
Source data: U.S. NLRB Annual Reports (public domain). Reconstruction by NLRB Stats Archive. Updated June 2026.