NLRB Stats Archive › Annual Reports › FY1965 › Valid votes cast in representation elections, by final results — elections in RM cases
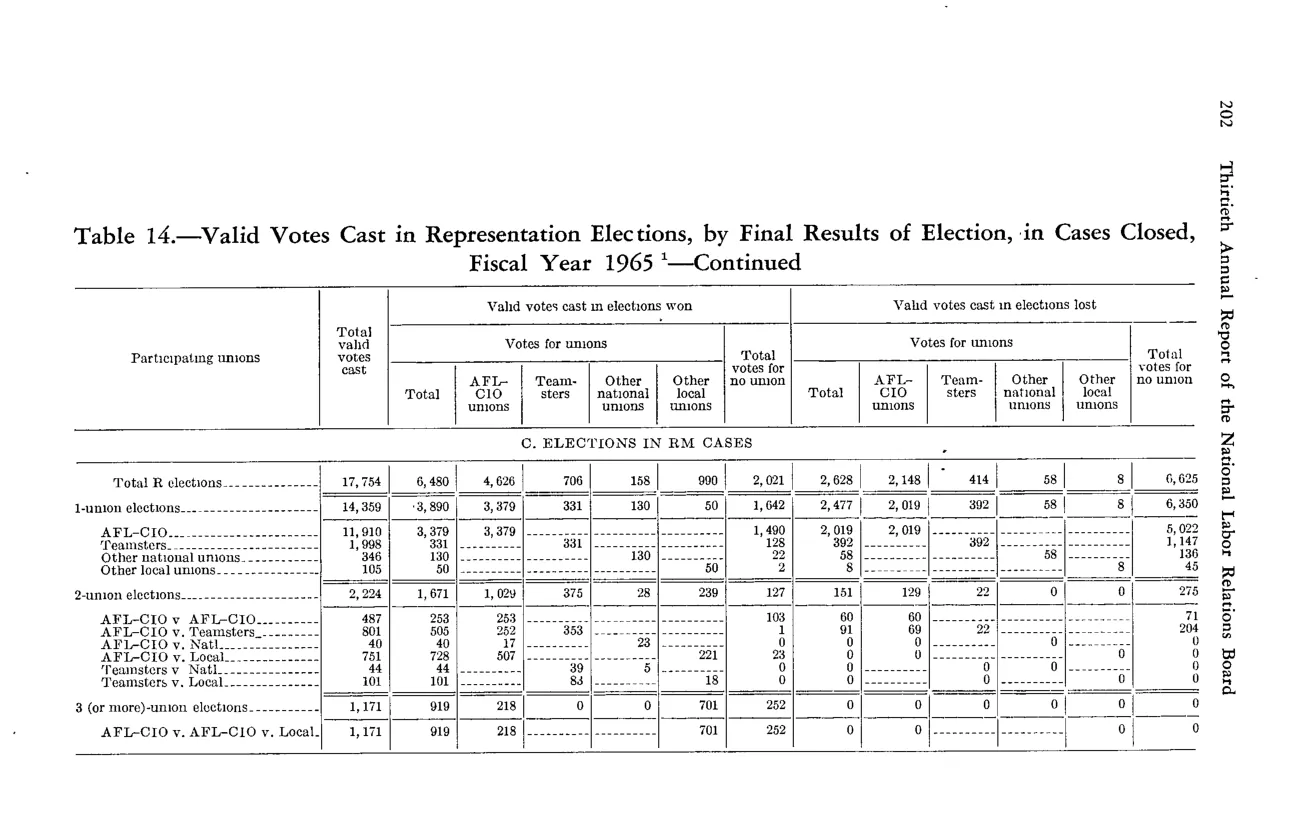
Valid votes cast in representation elections, by final results — elections in RM cases
| Participating unions | Total valid votes cast | Votes won Total | Votes won AFL-CIO | Votes won Teamsters | Votes won Other national | Votes won Other local | Votes won No union | Votes lost Total | Votes lost AFL-CIO | Votes lost Teamsters | Votes lost Other national | Votes lost Other local | Votes lost No union | |
|---|---|---|---|---|---|---|---|---|---|---|---|---|---|---|
| Total RM elections | 17,754 | 6,480 | 4,495 | 706 | 158 | 990 | 2,001 | 2,628 | 2,168 | 414 | 58 | 6,623 | ||
| 1-union elections (subtotal) | 14,359 | 3,890 | 3,379 | 331 | 130 | 50 | 1,642 | 2,477 | 2,019 | 392 | 58 | 6,350 | ||
| 1-union | ||||||||||||||
| 2-union elections (subtotal) | 2,224 | 1,671 | 1,029 | 375 | 28 | 239 | 127 | 151 | 179 | 22 | 273 | |||
| 2-union | ||||||||||||||
| 3 (or more)-union elections (RM) | 1,171 | 919 | 218 | 701 | 252 |
Source image
Source data: U.S. NLRB Annual Reports (public domain). Reconstruction by NLRB Stats Archive. Updated June 2026.