NLRB Stats Archive › Annual Reports › FY1964 › Representation elections held in cases closed
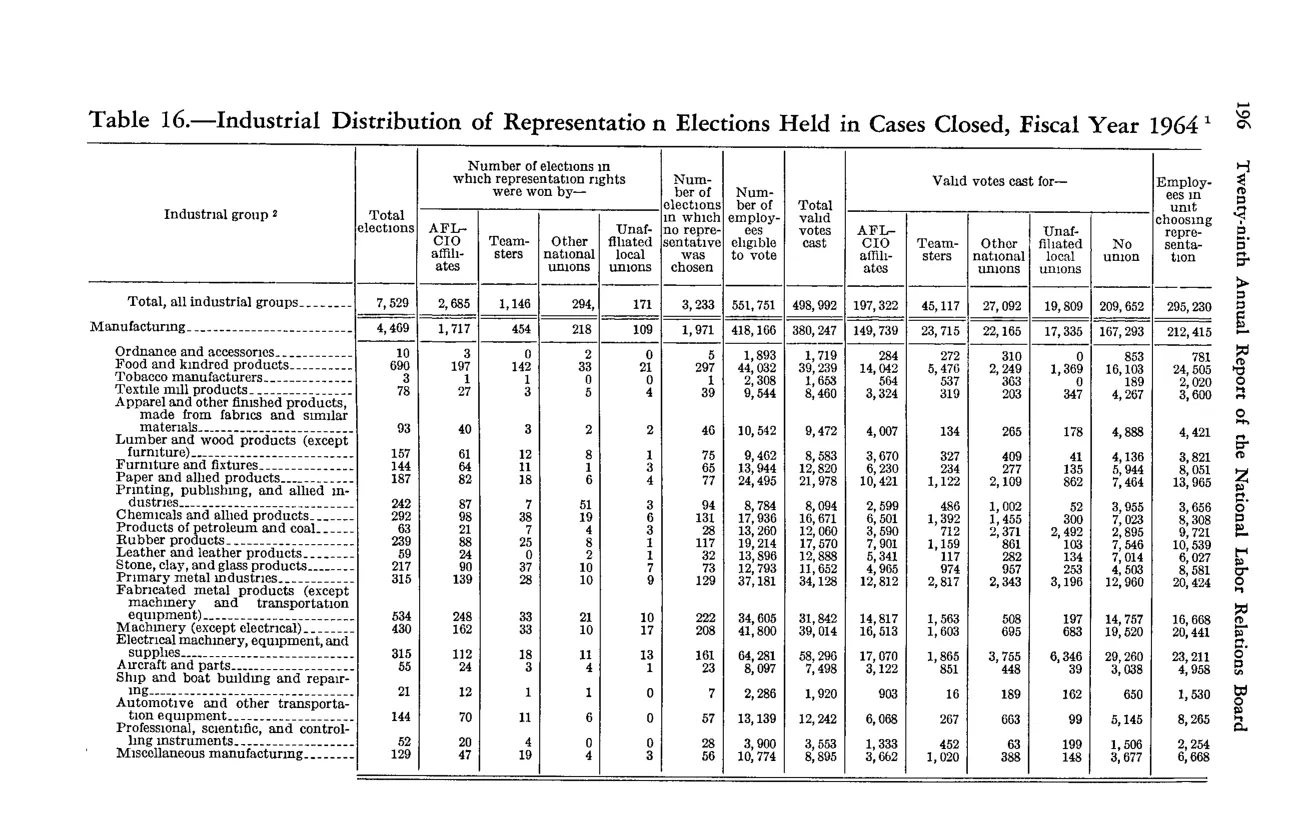
Representation elections held in cases closed
| Industrial group 2 | Total elections | Number of elections in which representation rights were won by | Number of elections in which representation rights were won by | Number of elections in which representation rights were won by | Number of elections in which representation rights were won by | Number of elections in which representation rights were won by | Number of elections in which no representative was chosen | Number of employees eligible to vote | Total valid votes cast | Valid votes cast for | Valid votes cast for | Valid votes cast for | Valid votes cast for | Valid votes cast for | Valid votes cast for | Employees in units chosen representation | |
|---|---|---|---|---|---|---|---|---|---|---|---|---|---|---|---|---|---|
| AFL-CIO affiliates | Teamsters | Other national unions | Unaffiliated national unions | Local unaffiliated unions | AFL-CIO affiliates | Teamsters | Other national unions | Unaffiliated national unions | Local unaffiliated unions | No union | |||||||
| Total, all industrial groups | 7,529 | 2,685 | 1,146 | 294 | 111 | 3,233 | 511,751 | 498,902 | 197,322 | 45,117 | 27,492 | 19,809 | 167,302 | 295,330 | |||
| Manufacturing (subtotal) | 4,459 | 1,717 | 454 | 139 | 33 | 1,971 | 408,153 | 380,247 | 149,759 | 23,715 | 22,161 | 17,887 | 139,520 | 167,302 | |||
| Manufacturing sub-industries (Ordnance, Food, Tobacco, Textile, Apparel, Lumber, Furniture, Paper, Printing, Chemicals, Petroleum, Rubber, Leather, Stone/clay/glass, Primary metal, Fabricated metal, Machinery, Electrical equipment, Transportation equipment, Aircraft, Ship and boat, Automotive, Professional/scientific instruments, Miscellaneous manufacturing) |
Source image
Source data: U.S. NLRB Annual Reports (public domain). Reconstruction by NLRB Stats Archive. Updated June 2026.