NLRB Stats Archive › Annual Reports › FY1962 › Collective bargaining elections — by industry
Collective bargaining elections — by industry
| Industrial group | Number of elections — Total | Number of elections in which representation rights were won by — AFL-CIO affiliates | Number of elections in which representation rights were won by — Unaffiliated unions | Number of elections in which no representative was chosen | Eligible voters | Valid votes cast |
|---|---|---|---|---|---|---|
| Total | 7,355 | 2,708 | 1,597 | 3,050 | 536,047 | 482,558 |
| Manufacturing | 4,391 | 1,754 | 806 | 1,831 | 409,810 | 373,016 |
| Agriculture, forestry, and fisheries | 9 | 4 | 1 | 4 | 211 | 184 |
| Mining | 85 | 18 | 34 | 33 | 2,904 | 2,567 |
| Construction | 136 | 79 | 16 | 41 | 5,329 | 4,617 |
| Wholesale trade | 711 | 132 | 276 | 303 | 16,645 | 14,967 |
| Retail trade | 1,043 | 392 | 184 | 467 | 31,886 | 28,145 |
| Finance, insurance, and real estate | 40 | 18 | 5 | 17 | 3,344 | 3,172 |
| Transportation, communication, and other public utilities | 620 | 179 | 211 | 230 | 47,262 | 40,610 |
| Services | 73 | 30 | 12 | 31 | 3,606 | 3,306 |
Source image
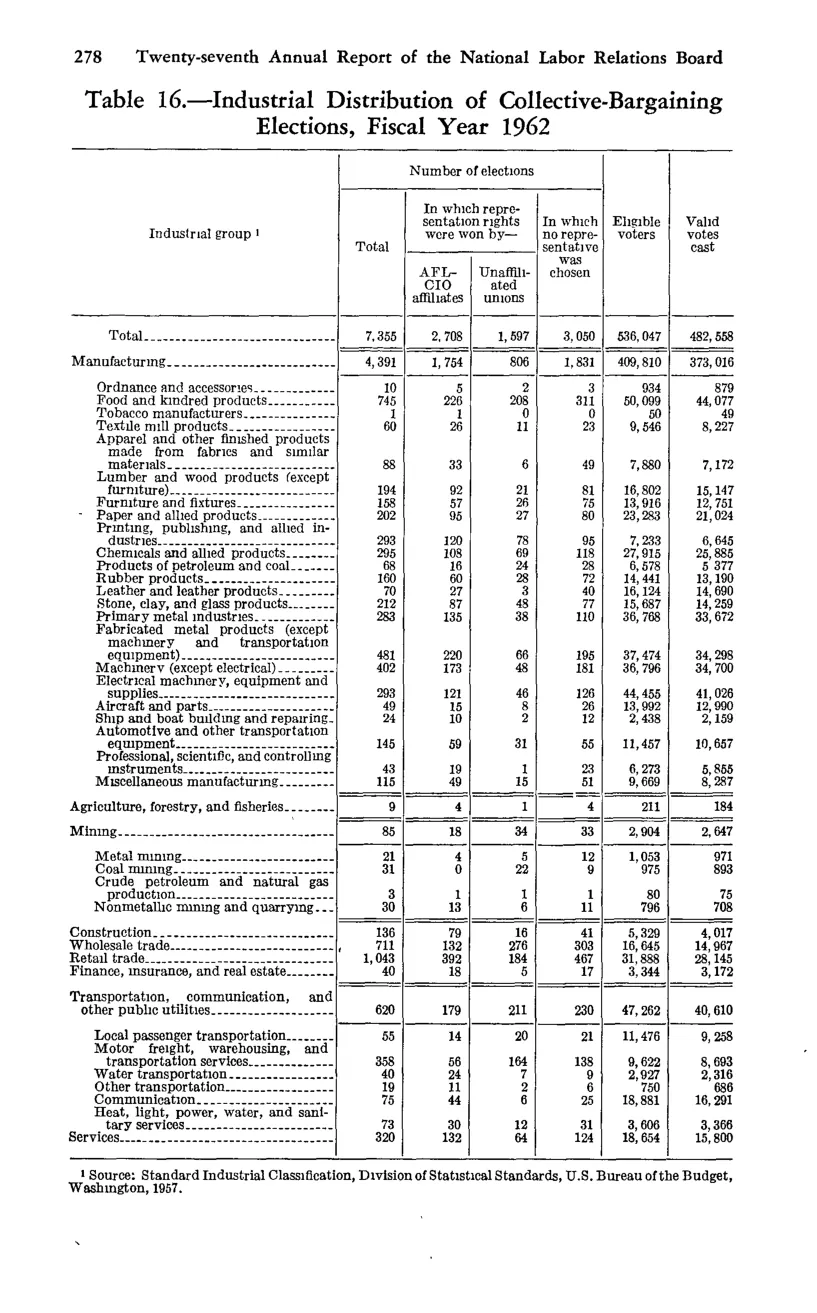
Source data: U.S. NLRB Annual Reports (public domain). Reconstruction by NLRB Stats Archive. Updated June 2026.