NLRB Stats Archive › Annual Reports › FY1957 › Collective-bargaining elections
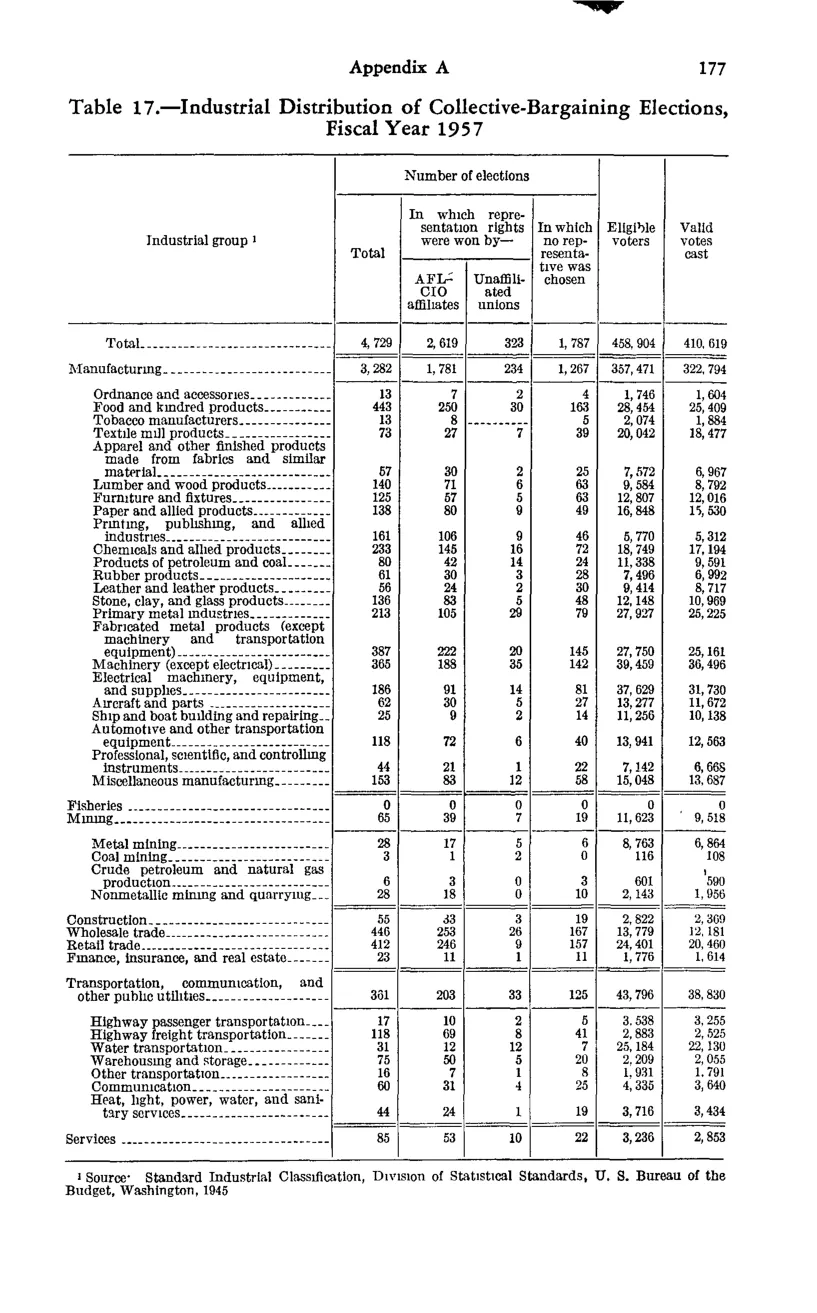
Collective-bargaining elections
| Industrial group 1 | Number of elections | Number of elections | Number of elections | Number of elections | Eligible voters | Valid votes cast |
|---|---|---|---|---|---|---|
| Industrial group 1 | Total | In which representation rights were won by — AFL-CIO affiliates | In which representation rights were won by — Unaffiliated unions | In which no representative was chosen | Eligible voters | Valid votes cast |
| Total | 4,729 | 2,619 | 323 | 1,787 | 458,904 | 410,619 |
| Manufacturing | 3,282 | 1,781 | 234 | 1,267 | 357,471 | 322,794 |
| Manufacturing subgroups (23 SIC categories) | ||||||
| Fisheries | 0 | 0 | 0 | 0 | 0 | 0 |
| Mining | 65 | 39 | 7 | 19 | 11,025 | 9,518 |
| Construction | 55 | 33 | 3 | 19 | 2,822 | 2,569 |
| Wholesale trade | 446 | 253 | 26 | 167 | 13,779 | 12,181 |
| Retail trade | 612 | 246 | 9 | 357 | 24,401 | 20,490 |
| Finance, insurance, and real estate | 23 | 11 | 1 | 11 | 1,770 | 1,614 |
| Transportation, communication, and other public utilities | 351 | 203 | 33 | 125 | 43,796 | 38,930 |
| Services | 85 | 53 | 19 | 32 | 2,902 | 2,853 |
Source image
Source data: U.S. NLRB Annual Reports (public domain). Reconstruction by NLRB Stats Archive. Updated June 2026.