NLRB Stats Archive › Annual Reports › FY1951 › Results of union-shop authorization polls
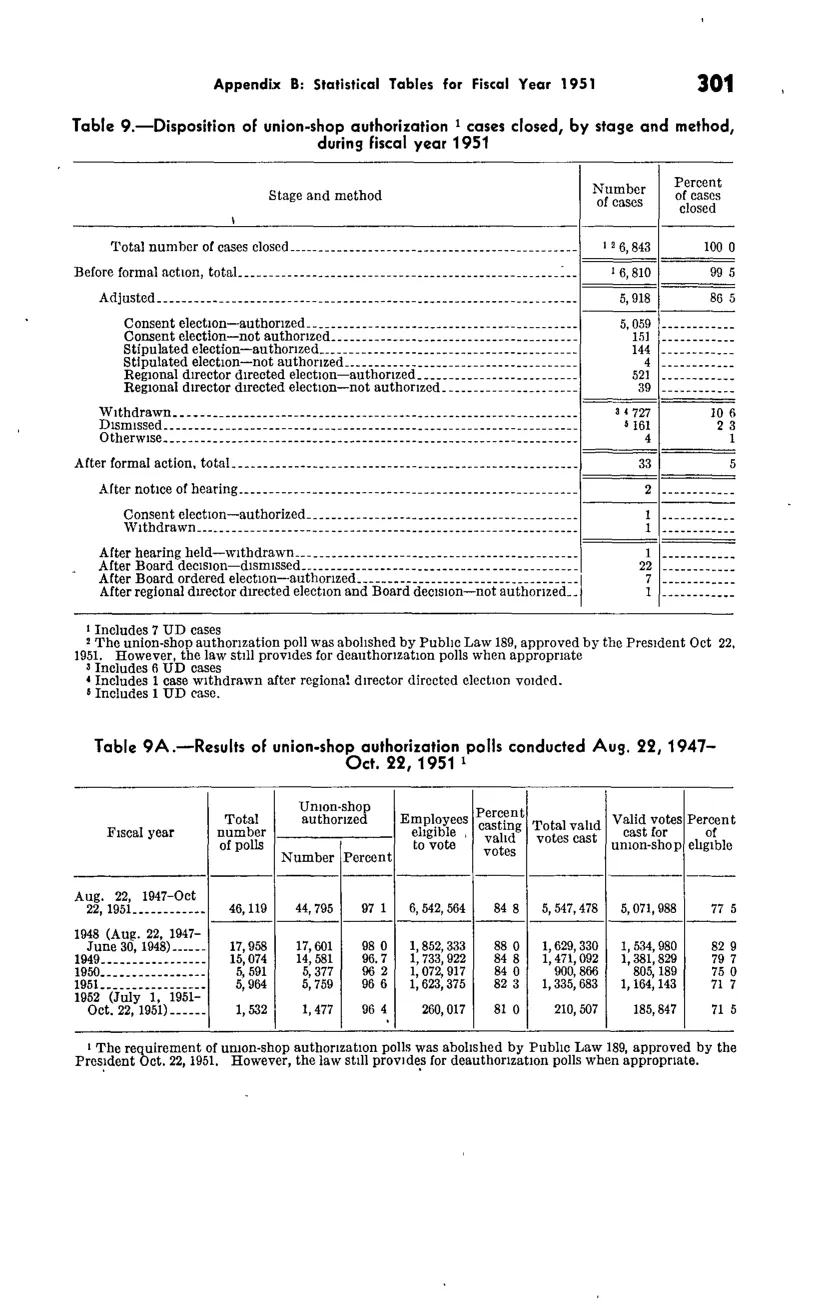
Results of union-shop authorization polls
| Fiscal year | Total number of polls | Union-shop authorized — Number | Union-shop authorized — Percent | Employees eligible to vote | Percent casting valid votes | Total valid votes cast | Valid votes cast for union-shop | Percent of eligible |
|---|---|---|---|---|---|---|---|---|
| Aug. 22, 1947 – Oct. 22, 1951 (cumulative) | 46,119 | 44,795 | 97.1 | 6,542,564 | 84.8 | 5,547,478 | 5,071,988 | 77.5 |
| 1948 (Aug. 22, 1947 – June 30, 1948) | 17,958 | 17,601 | 98 | 1,852,333 | 88 | 1,629,330 | 1,534,980 | 82.9 |
| 1949 | 15,074 | 14,581 | 96.7 | 1,733,922 | 84.8 | 1,471,092 | 1,381,829 | 79.7 |
| 1950 | 5,591 | 5,377 | 96.2 | 1,072,917 | 84 | 900,866 | 805,189 | 75 |
| 1951 | 5,964 | 5,759 | 96.6 | 1,623,375 | 82.3 | 1,335,683 | 1,164,143 | 71.7 |
| 1952 (July 1, 1951 – Oct. 22, 1951) | 1,532 | 1,477 | 96.4 | 260,017 | 81 | 210,507 | 185,847 | 71.5 |
Source image
Source data: U.S. NLRB Annual Reports (public domain). Reconstruction by NLRB Stats Archive. Updated June 2026.