NLRB Stats Archive › Annual Reports › FY1947 › Cases and workers involved in cases received — by month
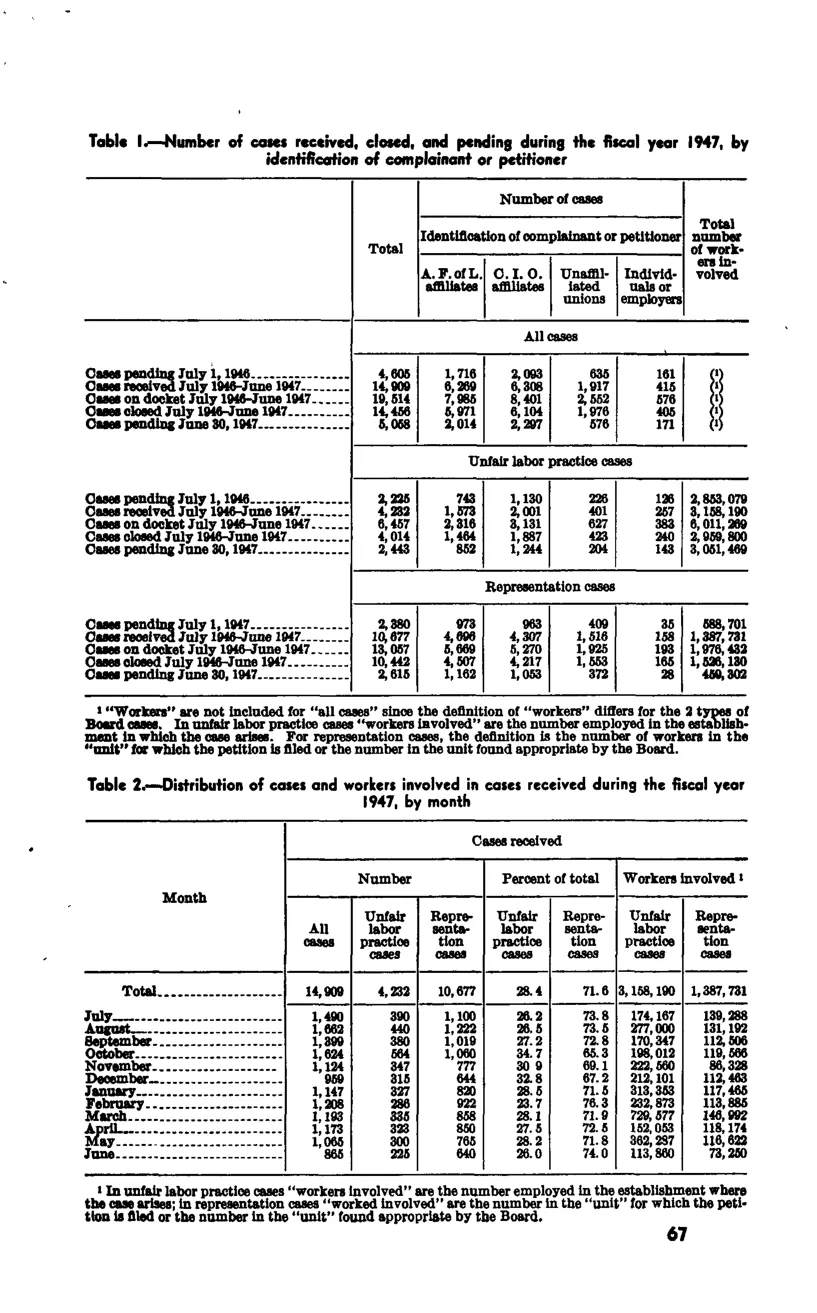
Cases and workers involved in cases received — by month
| Number | Number | Number | Percent of total | Percent of total | Workers involved | Workers involved | |
|---|---|---|---|---|---|---|---|
| All cases | Unfair labor practice cases | Representation cases | Unfair labor practice cases | Representation cases | Unfair labor practice cases | Representation cases | |
| Total | 14,909 | 4,232 | 10,677 | 28.4 | 71.6 | 3,158,190 | 1,387,731 |
| July | 1,490 | 390 | 1,100 | 26.2 | 73.8 | 174,167 | 139,288 |
| August | 1,662 | 440 | 1,222 | 26.5 | 73.5 | 277,000 | 131,192 |
| September | 1,309 | 290 | 1,019 | 27.2 | 72.8 | 170,347 | 112,506 |
| October | 1,624 | 564 | 1,060 | 34.7 | 65.3 | 198,012 | 119,656 |
| November | 1,124 | 347 | 777 | 30.9 | 69.1 | 222,560 | 86,328 |
| December | 959 | 315 | 644 | 32.8 | 67.2 | 212,101 | 112,463 |
| January | 1,147 | 327 | 820 | 28.5 | 71.5 | 313,353 | 117,465 |
| February | 1,208 | 286 | 922 | 23.7 | 76.3 | 322,873 | 113,585 |
| March | 1,193 | 335 | 858 | 28.1 | 71.9 | 729,577 | 146,992 |
| April | 1,173 | 323 | 850 | 27.5 | 72.5 | 152,053 | 118,174 |
| May | 1,055 | 290 | 765 | 28.2 | 71.8 | 362,237 | 116,622 |
| June | 865 | 225 | 640 | 26 | 74 | 113,860 | 73,260 |
Source image
Source data: U.S. NLRB Annual Reports (public domain). Reconstruction by NLRB Stats Archive. Updated June 2026.