NLRB Stats Archive › Annual Reports › FY1946 › Cases received — by industry
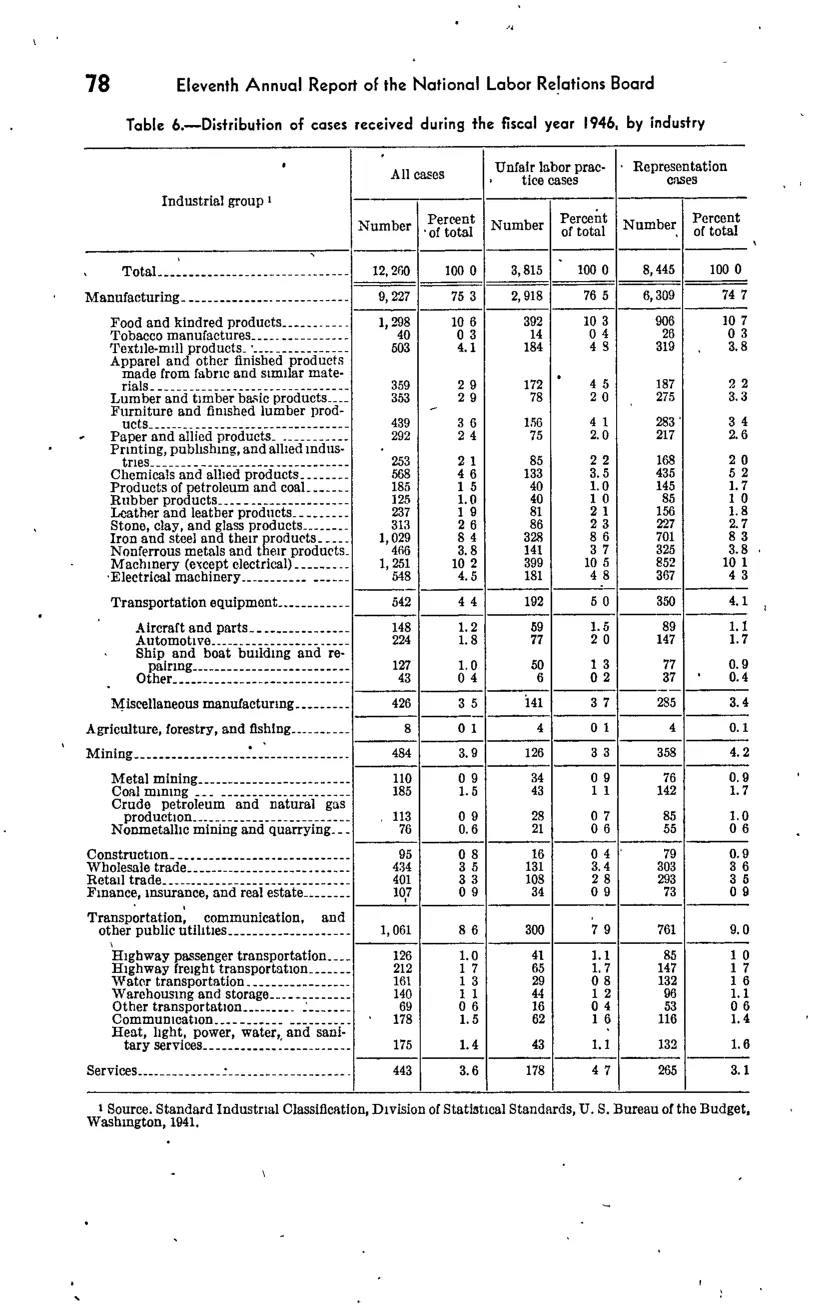
Cases received — by industry
| Industrial group | All cases | All cases | Unfair labor practice cases | Unfair labor practice cases | Representation cases | Representation cases |
|---|---|---|---|---|---|---|
| Industrial group | Number | Percent of total | Number | Percent of total | Number | Percent of total |
| Total | 12,260 | 100 | 3,815 | 100 | 8,445 | 100 |
| Manufacturing | 9,227 | 75.3 | 2,918 | 76.5 | 6,309 | 74.7 |
| Transportation equipment | 542 | 4.4 | 192 | 5 | 350 | 4.1 |
| Miscellaneous manufacturing | 426 | 3.5 | 141 | 3.7 | 285 | 3.4 |
| Agriculture, forestry, and fishing | 8 | 0.1 | 4 | 0.1 | 4 | 0.1 |
| Mining | 484 | 3.9 | 126 | 3.3 | 358 | 4.2 |
| Finance, insurance, and real estate | 107 | 0.9 | 34 | 0.9 | 73 | 0.9 |
| Transportation, communication, and other public utilities | 1,051 | 8.6 | 300 | 7.9 | 761 | 9 |
| Services | 443 | 3.6 | 178 | 4.7 | 265 | 3.1 |
Source image
Source data: U.S. NLRB Annual Reports (public domain). Reconstruction by NLRB Stats Archive. Updated June 2026.