NLRB Stats Archive › Annual Reports › FY1946 › Cases received and percent increase or decrease
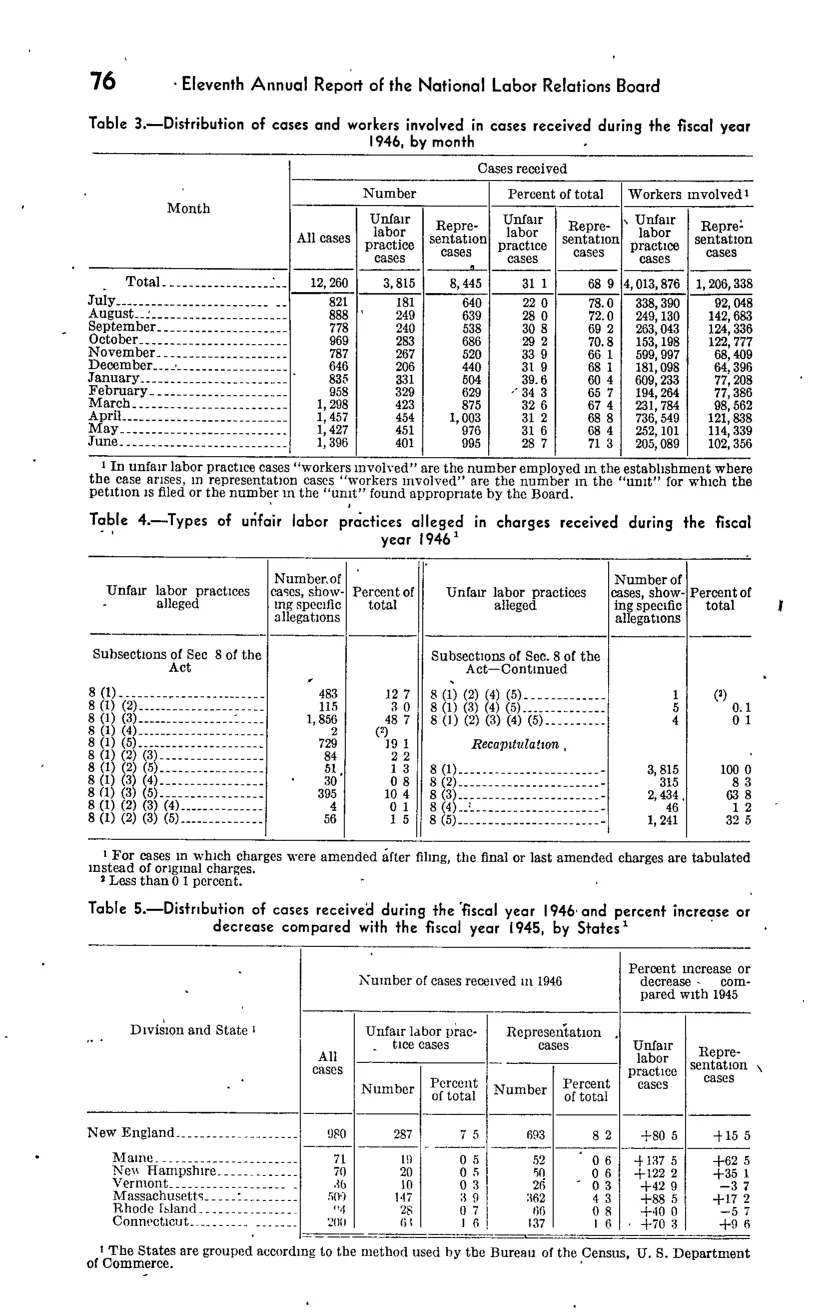
Cases received and percent increase or decrease
| Division and State | Number of cases received in 1946 | Number of cases received in 1946 | Number of cases received in 1946 | Number of cases received in 1946 | Number of cases received in 1946 | Percent increase or decrease compared with 1945 | Percent increase or decrease compared with 1945 |
|---|---|---|---|---|---|---|---|
| Division and State | All cases | Unfair labor practice cases | Unfair labor practice cases | Representation cases | Representation cases | Unfair labor practice cases | Representation cases |
| Division and State | All cases | Number | Percent of total | Number | Percent of total | Unfair labor practice cases | Representation cases |
| New England | 980 | 287 | 7.5 | 693 | 8.2 | +80.5 | +15.5 |
| Maine | 71 | 19 | 0.5 | 52 | 0.6 | +137.5 | +62.5 |
| New Hampshire | 70 | 20 | 0.5 | 50 | 0.6 | +122.2 | +35.1 |
| Vermont | 36 | 10 | 0.3 | 26 | 0.3 | +42.9 | -3.7 |
| Massachusetts | 509 | 147 | 3.9 | 362 | 4.3 | +88.5 | +17.2 |
| Rhode Island | 94 | 28 | 0.7 | 66 | 0.8 | +40.0 | -5.7 |
| Connecticut | 200 | 63 | 1.6 | 137 | 1.6 | +70.3 | +9.6 |
Source image
Source data: U.S. NLRB Annual Reports (public domain). Reconstruction by NLRB Stats Archive. Updated June 2026.