NLRB Stats Archive › Annual Reports › FY1945 › Distribution of cases and workers involved in cases received
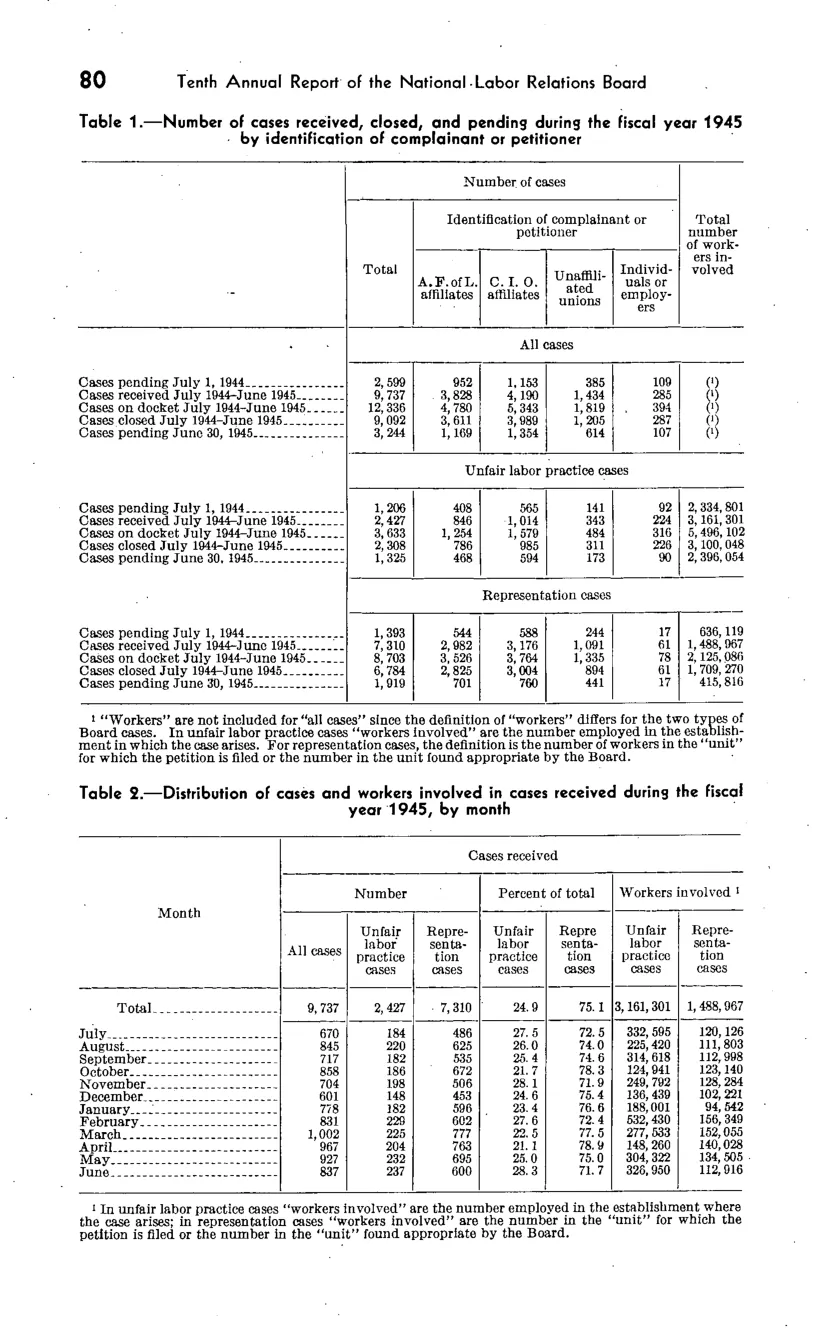
Distribution of cases and workers involved in cases received
| Month | Cases received | Cases received | Cases received | Cases received | Cases received | Cases received | Cases received |
|---|---|---|---|---|---|---|---|
| Month | Number | Number | Number | Percent of total | Percent of total | Workers involved | Workers involved |
| Month | All cases | Unfair labor practice cases | Representation cases | Unfair labor practice cases | Representation cases | Unfair labor practice cases | Representation cases |
| Total | 9,737 | 2,427 | 7,310 | 24.9 | 75.1 | 3,161,301 | 1,488,967 |
| July | 670 | 184 | 486 | 27.5 | 72.5 | 332,595 | 120,126 |
| August | 845 | 220 | 625 | 26 | 74 | 225,420 | 111,803 |
| September | 717 | 182 | 535 | 25.4 | 74.6 | 313,618 | 112,998 |
| October | 858 | 186 | 672 | 21.7 | 78.3 | 124,941 | 123,140 |
| November | 704 | 198 | 506 | 28.1 | 71.9 | 249,792 | 128,284 |
| December | 601 | 148 | 453 | 24.6 | 75.4 | 136,439 | 102,221 |
| January | 778 | 182 | 596 | 23.4 | 76.6 | 84,542 | 94,642 |
| February | 831 | 225 | 602 | 27.6 | 72.4 | 532,430 | 156,949 |
| March | 1,002 | 225 | 777 | 22.5 | 77.5 | 277,533 | 152,055 |
| April | 967 | 204 | 763 | 21.1 | 78.9 | 148,260 | 140,028 |
| May | 927 | 232 | 695 | 25 | 75 | 304,322 | 134,505 |
| June | 837 | 237 | 600 | 28.3 | 71.7 | 326,950 | 112,916 |
Source image
Source data: U.S. NLRB Annual Reports (public domain). Reconstruction by NLRB Stats Archive. Updated June 2026.