NLRB Stats Archive › Annual Reports › FY1944 › Distribution of cases received
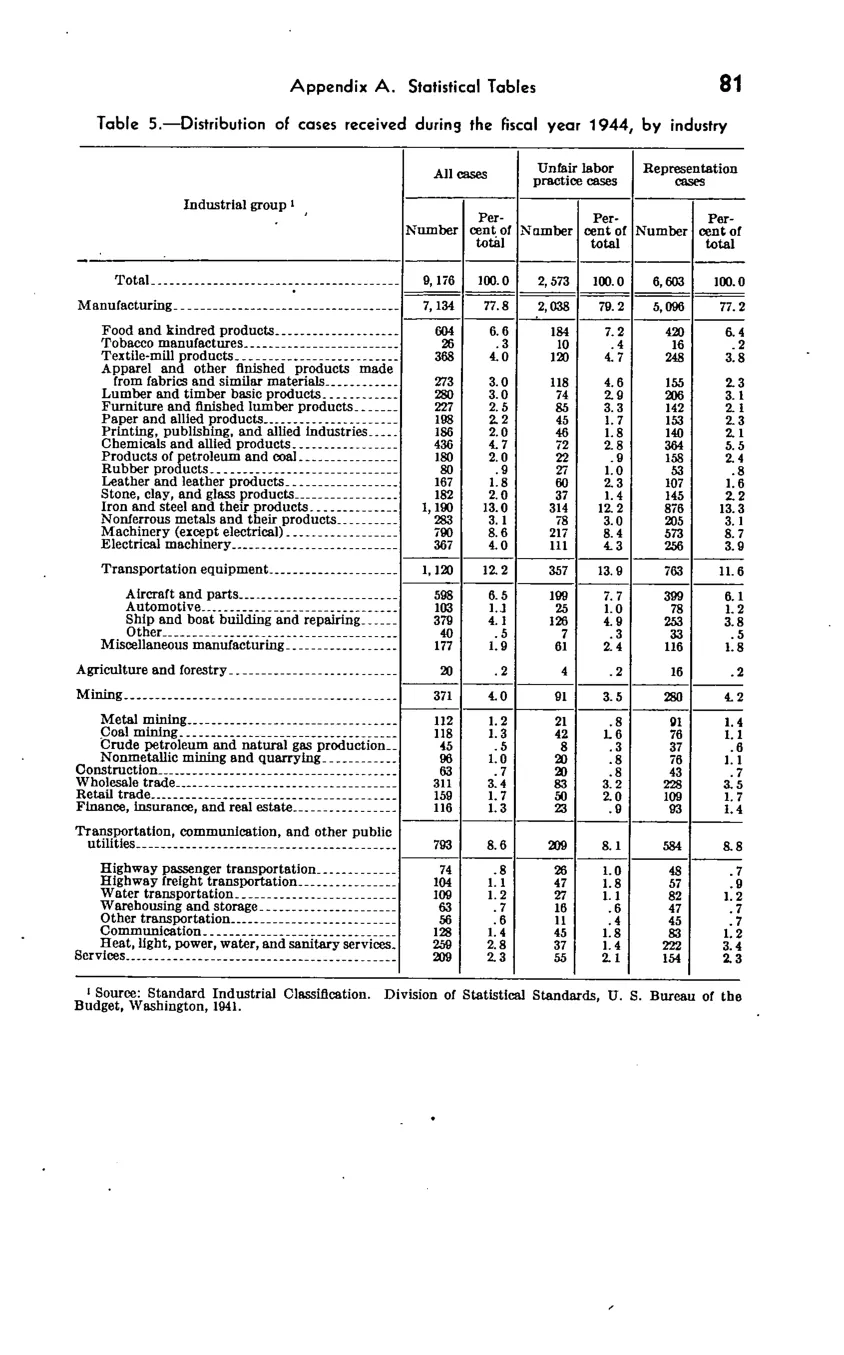
Distribution of cases received
| Industrial group | All cases | All cases | Unfair labor practice cases | Unfair labor practice cases | Representation cases | Representation cases |
|---|---|---|---|---|---|---|
| Industrial group | Number | Percent of total | Number | Percent of total | Number | Percent of total |
| Total | 9,176 | 100 | 2,573 | 100 | 6,603 | 100 |
| Manufacturing | 7,134 | 77.8 | 2,038 | 79.2 | 5,096 | 77.2 |
| Transportation equipment | 1,120 | 12.2 | 357 | 13.9 | 763 | 11.6 |
| Miscellaneous manufacturing | 177 | 1.9 | 61 | 2.4 | 116 | 1.8 |
| Agriculture and forestry | 20 | 0.2 | 4 | 0.2 | 16 | 0.2 |
| Mining | 371 | 4 | 91 | 3.5 | 280 | 4.2 |
| Construction | 63 | 0.7 | 20 | 0.8 | 43 | 0.7 |
| Wholesale trade | 311 | 3.4 | 83 | 3.2 | 228 | 3.5 |
| Retail trade | 159 | 1.7 | 50 | 2 | 109 | 1.7 |
| Finance, insurance, and real estate | 116 | 1.3 | 23 | 0.9 | 93 | 1.4 |
| Transportation, communication, and other public utilities | 793 | 8.6 | 209 | 8.1 | 584 | 8.8 |
| Services | 209 | 2.3 | 55 | 2.1 | 154 | 2.3 |
Source image
Source data: U.S. NLRB Annual Reports (public domain). Reconstruction by NLRB Stats Archive. Updated June 2026.