NLRB Stats Archive › Annual Reports › FY1944 › Cases and workers involved in cases received
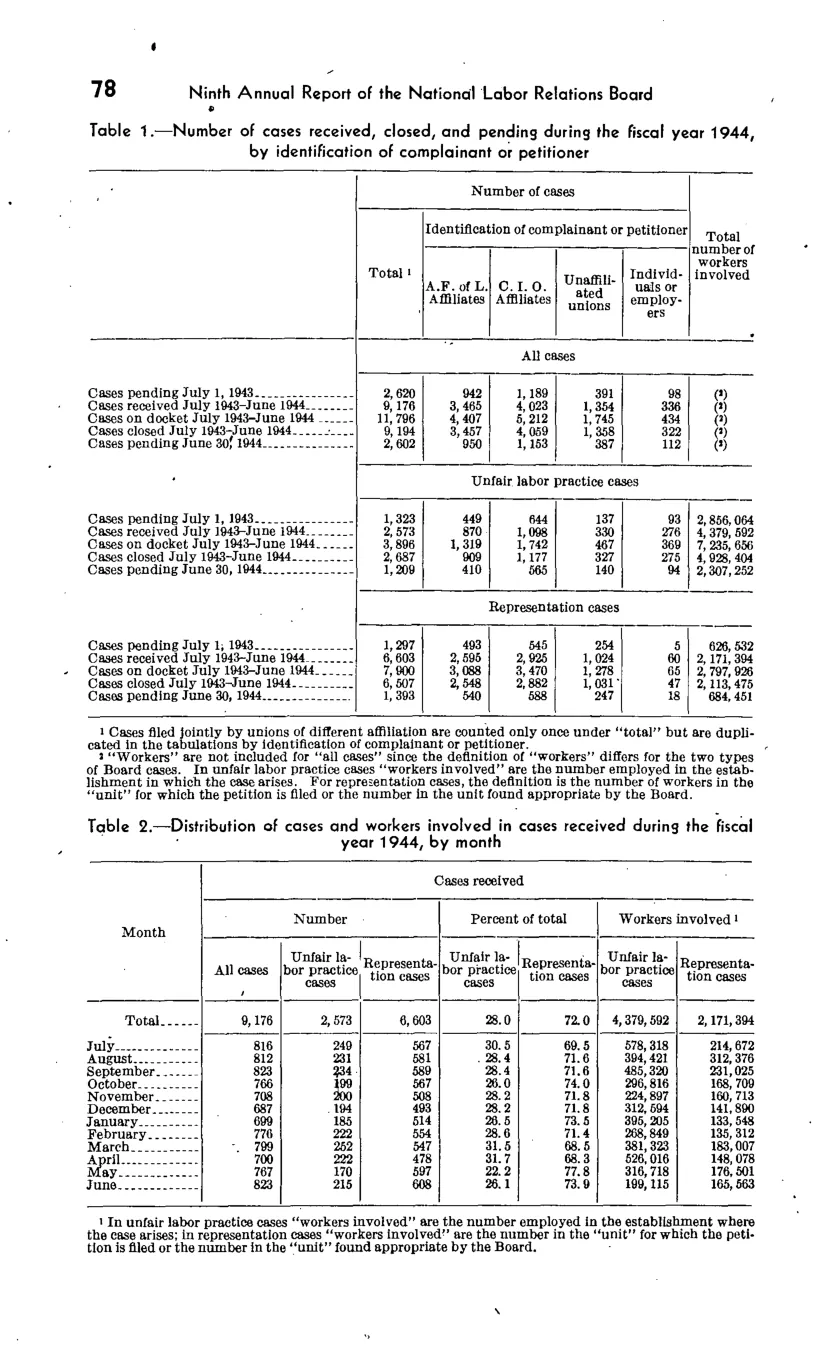
Cases and workers involved in cases received
| Month | Cases received | Cases received | Cases received | Cases received | Cases received | Cases received | Cases received |
|---|---|---|---|---|---|---|---|
| Month | Number | Number | Number | Percent of total | Percent of total | Workers involved | Workers involved |
| Month | All cases | Unfair labor practice cases | Representation cases | Unfair labor practice cases | Representation cases | Unfair labor practice cases | Representation cases |
| Total | 9,176 | 2,573 | 6,603 | 28 | 72 | 4,379,592 | 2,171,394 |
| July | 816 | 249 | 567 | 30.5 | 69.5 | 578,318 | 214,672 |
| August | 812 | 231 | 581 | 28.4 | 71.6 | 394,421 | 312,376 |
| September | 823 | 234 | 589 | 28.4 | 71.6 | 485,320 | 231,025 |
| October | 766 | 199 | 567 | 26 | 74 | 296,816 | 168,709 |
| November | 708 | 200 | 508 | 28.2 | 71.8 | 224,897 | 160,713 |
| December | 687 | 194 | 493 | 28.2 | 71.8 | 312,594 | 141,890 |
| January | 699 | 185 | 514 | 28.5 | 73.5 | 285,255 | 133,548 |
| February | 776 | 222 | 554 | 28.6 | 71.4 | 308,449 | 135,312 |
| March | 799 | 252 | 547 | 31.5 | 68.5 | 381,323 | 183,007 |
| April | 700 | 222 | 478 | 31.7 | 68.3 | 526,016 | 148,078 |
| May | 767 | 170 | 597 | 22.2 | 77.8 | 316,718 | 176,501 |
| June | 823 | 215 | 608 | 26.1 | 73.9 | 169,115 | 165,563 |
Source image
Source data: U.S. NLRB Annual Reports (public domain). Reconstruction by NLRB Stats Archive. Updated June 2026.