NLRB Stats Archive › Annual Reports › FY1944 › Cases filed — by type
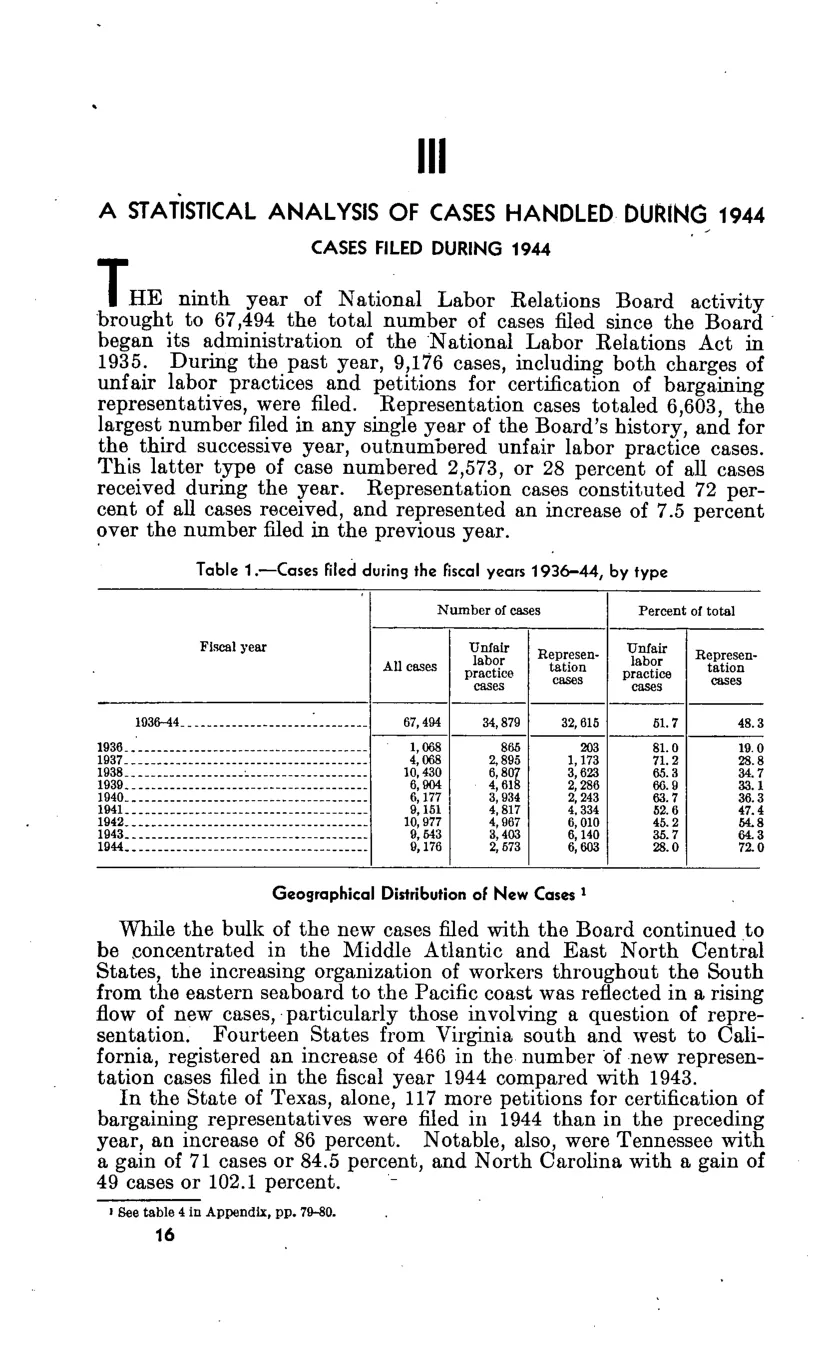
Cases filed — by type
| Fiscal year | Number of cases | Number of cases | Number of cases | Percent of total | Percent of total |
|---|---|---|---|---|---|
| Fiscal year | All cases | Unfair labor practice cases | Representation cases | Unfair labor practice cases | Representation cases |
| 1936-44 | 67,494 | 34,879 | 32,615 | 51.7 | 48.3 |
| 1936 | 1,068 | 865 | 203 | 81 | 19 |
| 1937 | 4,068 | 2,895 | 1,173 | 71.2 | 28.8 |
| 1938 | 10,430 | 6,807 | 3,623 | 65.3 | 34.7 |
| 1939 | 6,904 | 4,618 | 2,286 | 66.9 | 33.1 |
| 1940 | 6,177 | 3,934 | 2,243 | 63.7 | 36.3 |
| 1941 | 9,151 | 4,817 | 4,334 | 52.6 | 47.4 |
| 1942 | 10,977 | 4,967 | 6,010 | 45.2 | 54.8 |
| 1943 | 9,543 | 3,403 | 6,140 | 35.7 | 64.3 |
| 1944 | 9,176 | 2,573 | 6,603 | 28 | 72 |
Source image
Source data: U.S. NLRB Annual Reports (public domain). Reconstruction by NLRB Stats Archive. Updated June 2026.