NLRB Stats Archive › Annual Reports › FY1943 › Distribution of cases received
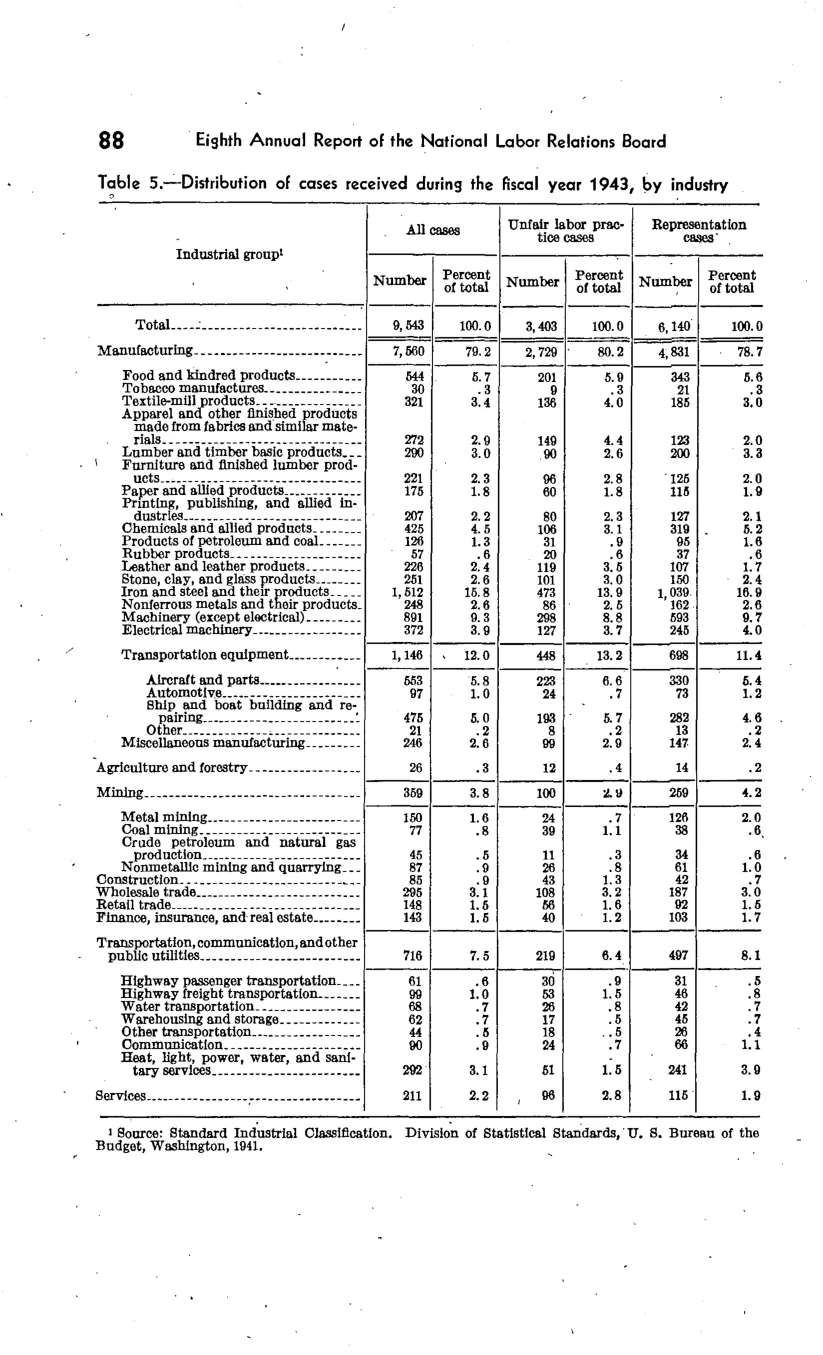
Distribution of cases received
| Industrial group | All cases | All cases | Unfair labor practice cases | Unfair labor practice cases | Representation cases | Representation cases |
|---|---|---|---|---|---|---|
| Industrial group | Number | Percent of total | Number | Percent of total | Number | Percent of total |
| Total | 9,543 | 100 | 3,403 | 100 | 6,140 | 100 |
| Manufacturing | 7,550 | 79.2 | 2,729 | 80.2 | 4,821 | 78.7 |
| Transportation equipment | 1,146 | 12 | 448 | 13.2 | 698 | 11.4 |
| Miscellaneous manufacturing | 266 | 2.8 | 99 | 2.9 | 147 | 2.4 |
| Agriculture and forestry | 26 | 0.3 | 12 | 0.4 | 14 | 0.2 |
| Mining | 359 | 3.8 | 100 | 2.9 | 259 | 4.2 |
| Construction | 85 | 0.9 | 42 | 1.3 | 43 | 0.7 |
| Wholesale trade | 295 | 3.1 | 108 | 3.2 | 187 | 3 |
| Retail trade | 148 | 1.5 | 56 | 1.7 | 92 | 1.5 |
| Finance, insurance, and real estate | 143 | 1.5 | 40 | 1.2 | 103 | 1.7 |
| Transportation, communication, and other public utilities | 716 | 7.5 | 219 | 6.4 | 497 | 8.1 |
| Services | 211 | 2.2 | 96 | 2.8 | 115 | 1.9 |
Source image
Source data: U.S. NLRB Annual Reports (public domain). Reconstruction by NLRB Stats Archive. Updated June 2026.