NLRB Stats Archive › Annual Reports › FY1942 › Distribution of workers and valid votes in leading manufacturing industries
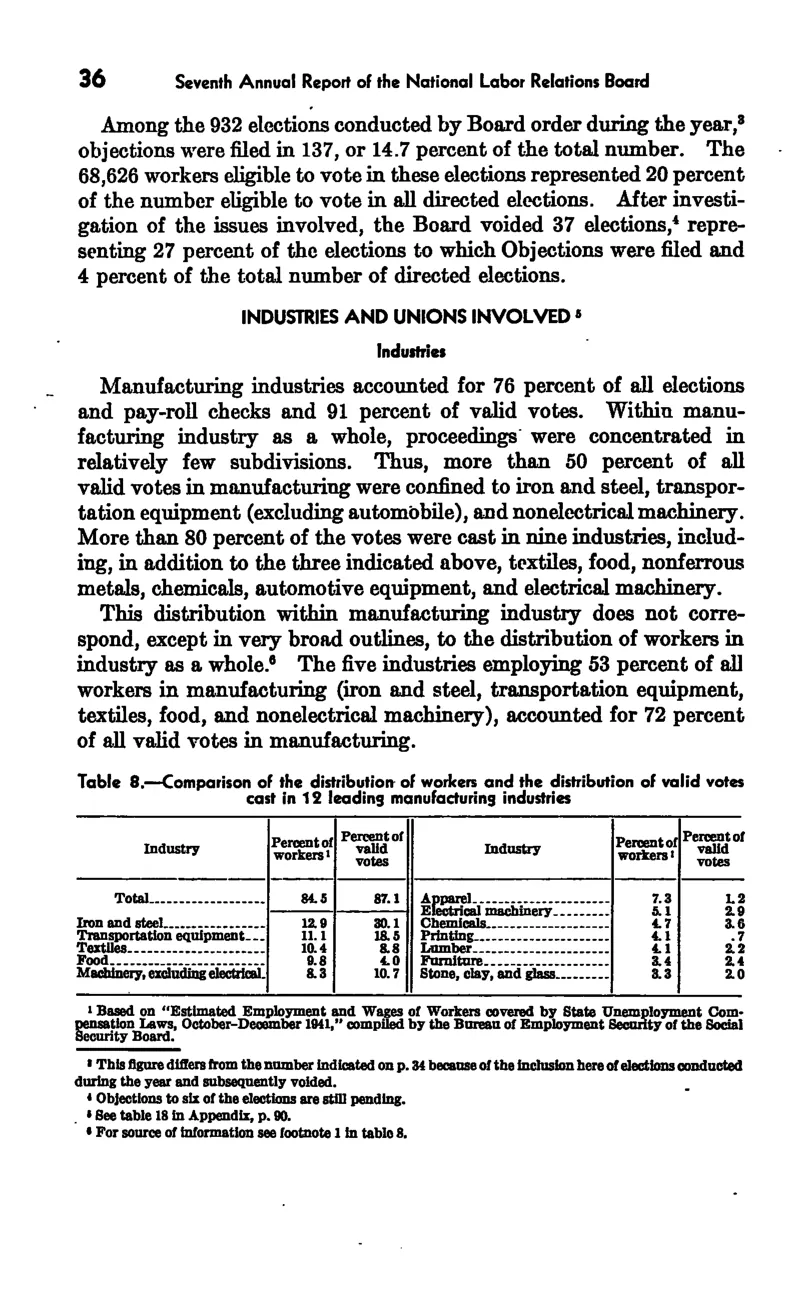
Distribution of workers and valid votes in leading manufacturing industries
| Industry | Percent of workers | Percent of valid votes |
|---|---|---|
| Total | 84.5 | 87.1 |
| Iron and steel | 12.9 | 30.1 |
| Transportation equipment | 11.1 | 18.5 |
| Textiles | 10.4 | 8.8 |
| Food | 9.8 | 4 |
| Machinery, excluding electrical | 8.3 | 10.7 |
| Apparel | 7.3 | 1.2 |
| Electrical machinery | 5.1 | 2.9 |
| Chemicals | 4.7 | 3.6 |
| Printing | 4.1 | 0.7 |
| Lumber | 4.1 | 2.2 |
| Furniture | 3.4 | 2.4 |
| Stone, clay, and glass | 3.3 | 2 |
Source image
Source data: U.S. NLRB Annual Reports (public domain). Reconstruction by NLRB Stats Archive. Updated June 2026.