NLRB Stats Archive › Annual Reports › FY1942 › Industries with preponderance of representation cases
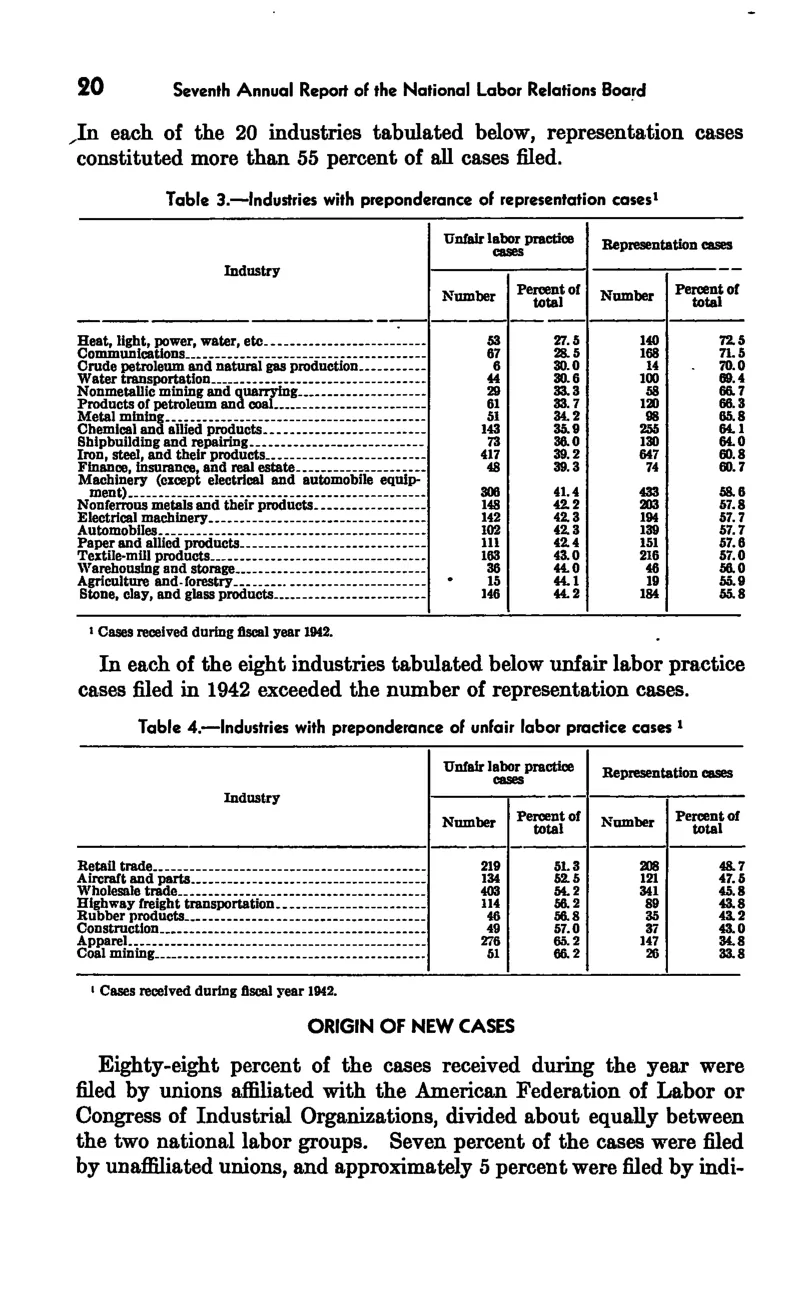
Industries with preponderance of representation cases
| Industry | Unfair labor practice cases | Unfair labor practice cases | Representation cases | Representation cases |
|---|---|---|---|---|
| Industry | Number | Percent of total | Number | Percent of total |
| Heat, light, power, water, etc. | 53 | 27.5 | 140 | 72.5 |
| Communications | 67 | 28.5 | 168 | 71.5 |
| Crude petroleum and natural gas production | 6 | 30 | 14 | 70 |
| Water transportation | 44 | 30.6 | 100 | 69.4 |
| Nonmetallic mining and quarrying | 29 | 33.3 | 58 | 66.7 |
| Products of petroleum and coal | 61 | 33.7 | 120 | 66.3 |
| Metal mining | 51 | 34.2 | 98 | 65.8 |
| Chemical and allied products | 143 | 35.9 | 255 | 64.1 |
| Shipbuilding and repairing | 73 | 36 | 130 | 64 |
| Iron, steel, and their products | 417 | 39.2 | 647 | 60.8 |
| Finance, insurance, and real estate | 48 | 39.3 | 74 | 60.7 |
| Machinery (except electrical and automobile equipment) | 306 | 41.4 | 433 | 58.6 |
| Nonferrous metals and their products | 148 | 42.2 | 203 | 57.8 |
| Electrical machinery | 142 | 42.3 | 194 | 57.7 |
| Automobiles | 102 | 42.3 | 139 | 57.7 |
| Paper and allied products | 111 | 42.4 | 151 | 57.6 |
| Textile-mill products | 163 | 43.1 | 216 | 56.9 |
| Warehousing and storage | 38 | 44 | 46 | 56 |
| Agriculture and forestry | 15 | 44.1 | 19 | 55.9 |
| Stone, clay, and glass products | 146 | 44.2 | 184 | 55.8 |
Source image
Source data: U.S. NLRB Annual Reports (public domain). Reconstruction by NLRB Stats Archive. Updated June 2026.