NLRB Stats Archive › Annual Reports › FY1940 › Workers involved in cases brought before the NLRB and workers involved in strikes
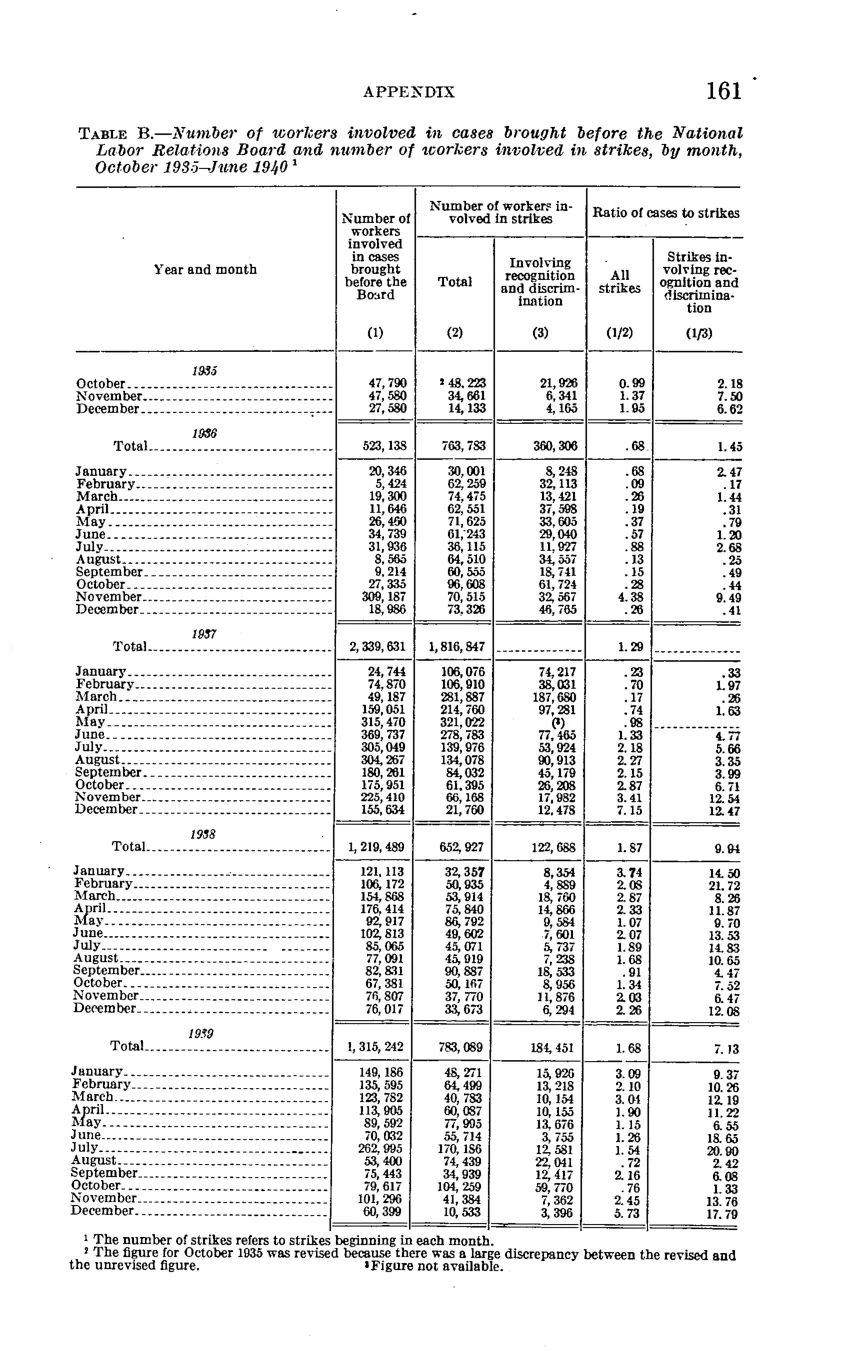
Workers involved in cases brought before the NLRB and workers involved in strikes
| Year and month | Number of workers involved in cases brought before the Board | Number of workers involved in strikes — Total | Number of workers involved in strikes — Involving recognition and discrimination | Ratio of cases to strikes — All strikes | Ratio of cases to strikes — Strikes involving recognition and discrimination |
|---|---|---|---|---|---|
| (1) | (2) | (3) | (1/2) | (1/3) | |
| 1935 October | 47,790 | 48,223 | 21,926 | 0.99 | 2.18 |
| 1935 November | 47,580 | 34,661 | 6,341 | 1.37 | 7.5 |
| 1935 December | 37,580 | 14,133 | 4,155 | 1.65 | 4.69 |
| 1936 Total | 523,135 | 763,750 | 360,306 | 0.68 | 1.45 |
| 1937 Total | 2,339,631 | 1,816,847 | 1.29 | ||
| 1938 Total | 1,219,489 | 632,927 | 127,658 | 1.87 | 9.94 |
| 1939 Total | 1,315,242 | 783,089 | 184,431 | 1.68 | 7.13 |
Source image
Source data: U.S. NLRB Annual Reports (public domain). Reconstruction by NLRB Stats Archive. Updated June 2026.