NLRB Stats Archive › Annual Reports › FY1939 › Workers involved in NLRB cases vs. workers involved in strikes
Workers involved in NLRB cases vs. workers involved in strikes
| Year and month | Number of workers involved in cases brought before Board (1) | Number of workers involved in strikes — For all causes (2) | Number of workers involved in strikes — For organization (3) | Ratio of Board cases to strikes — Percent for all causes [(1) over (2)] | Ratio of Board cases to strikes — Percent for organization [(1) over (3)] |
|---|---|---|---|---|---|
| 1935 — October | 47,790 | 92,357 | 28,213 | 52 | 169 |
| 1936 — Total | 523,138 | 763,783 | 419,538 | 68 | 125 |
| 1937 — Total | 2,339,631 | 1,816,847 | 1,031,229 | 129 | 222 |
| 1938 — Total | 1,319,459 | 622,927 | 195,748 | 187 | 620 |
| 1939 — January | 149,196 | 45,271 | 18,719 | 329 | 822 |
Source image
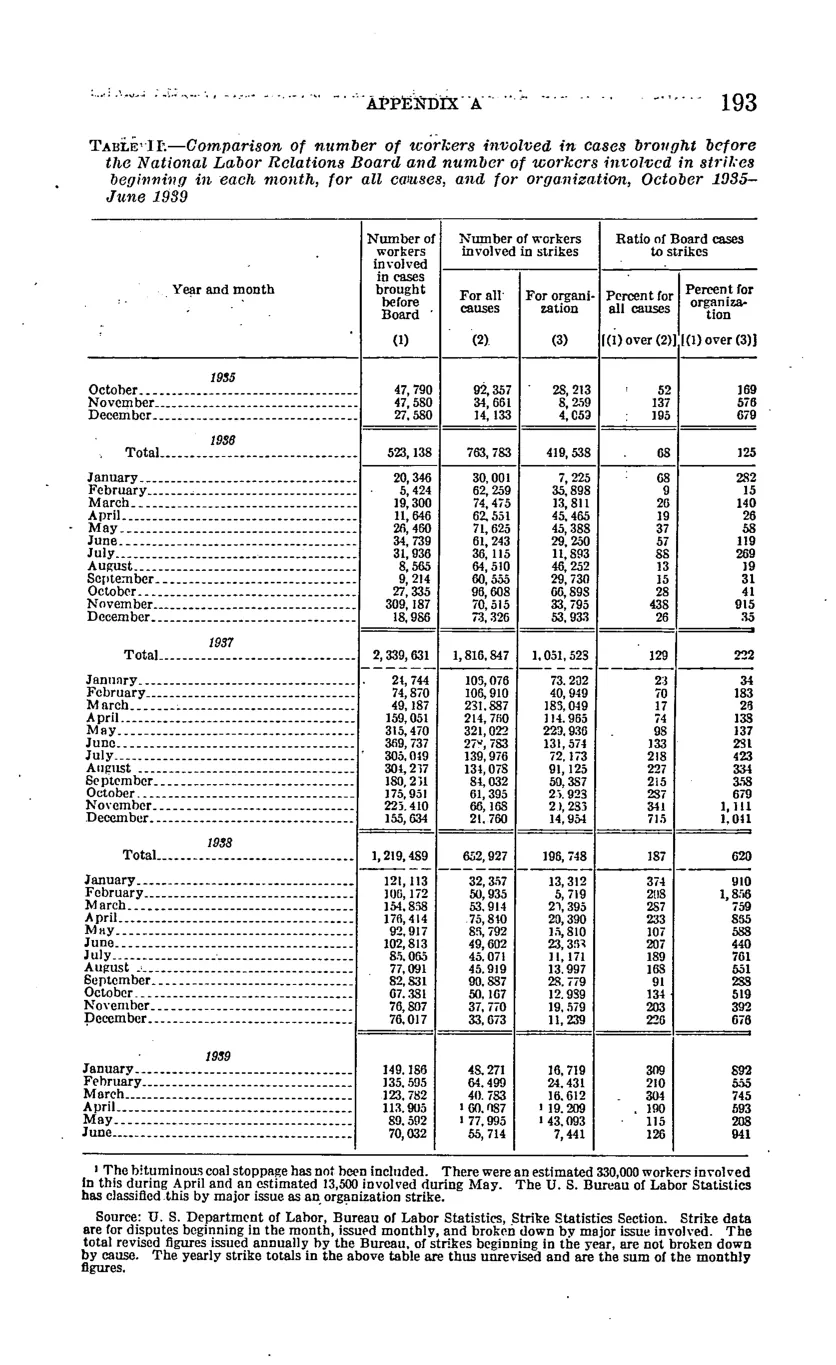
Source data: U.S. NLRB Annual Reports (public domain). Reconstruction by NLRB Stats Archive. Updated June 2026.