NLRB Stats Archive › Annual Reports › FY1938 › Workers involved in NLRB cases compared with workers involved in strikes — for all causes and for organization
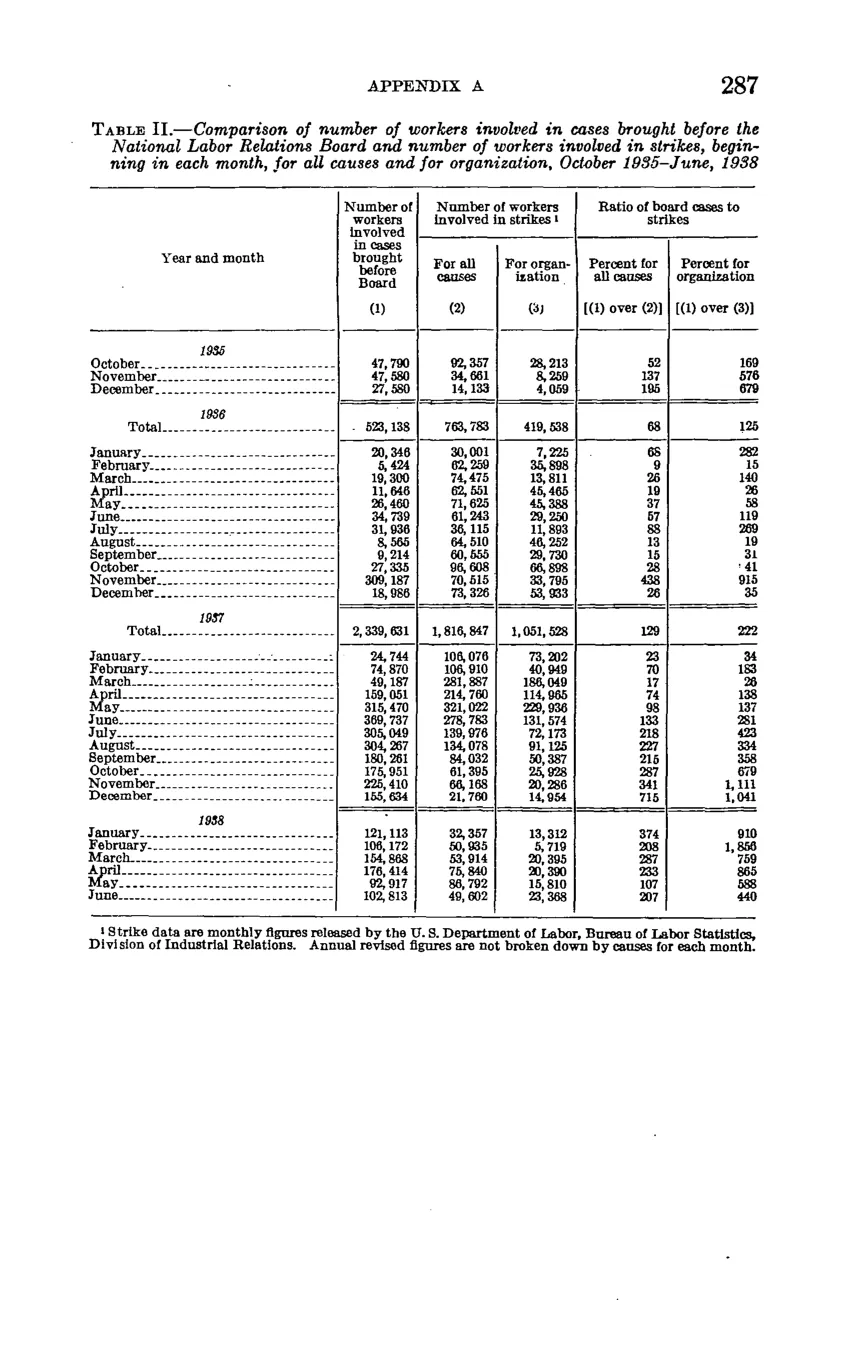
Workers involved in NLRB cases compared with workers involved in strikes — for all causes and for organization
| Year and month | Number of workers involved in cases brought before Board (1) | Number of workers involved in strikes For all causes (2) | Number of workers involved in strikes For organization (3) | Ratio of Board cases to strikes Percent for all causes [(1) over (2)] | Ratio of Board cases to strikes Percent for organization [(1) over (3)] |
|---|---|---|---|---|---|
| 1935 | |||||
| October | 47,790 | 92,357 | 28,213 | 52 | 169 |
| November | 47,580 | 34,661 | 8,259 | 137 | 576 |
| December | 27,580 | 14,133 | 4,059 | 195 | 679 |
| Total (1935) | 523,138 | 763,783 | 419,538 | 68 | 125 |
| 1936 | |||||
| January | 20,346 | 30,001 | 7,225 | 68 | 282 |
| February | 5,424 | 62,259 | 35,898 | 9 | 15 |
| March | 19,300 | 74,475 | 13,811 | 26 | 140 |
| April | 11,646 | 62,551 | 44,484 | 19 | 26 |
| May | 26,460 | 71,625 | 45,388 | 37 | 58 |
| June | 34,739 | 61,243 | 29,250 | 57 | 119 |
| July | 31,936 | 36,115 | 11,893 | 88 | 269 |
| August | 8,555 | 64,510 | 46,232 | 13 | 19 |
| September | 9,114 | 60,555 | 29,750 | 15 | 31 |
| October | 27,335 | 96,608 | 66,898 | 28 | 41 |
| November | 309,187 | 70,515 | 33,795 | 438 | 915 |
| December | 18,986 | 73,326 | 53,333 | 26 | 35 |
| Total (1936) | 2,339,631 | 1,816,847 | 1,051,528 | 129 | 222 |
| 1937 | |||||
| January | 24,744 | 106,076 | 73,202 | 23 | 34 |
| February | 74,870 | 106,910 | 40,949 | 70 | 183 |
| March | 49,187 | 281,387 | 188,049 | 17 | 26 |
| April | 159,051 | 214,760 | 114,985 | 74 | 138 |
| May | 315,470 | 203,622 | 229,936 | 98 | 137 |
| June | 399,737 | 278,783 | 131,574 | 133 | 281 |
| July | 305,049 | 139,976 | 72,173 | 218 | 423 |
| August | 304,267 | 134,078 | 91,125 | 227 | 334 |
| September | 180,281 | 84,033 | 50,387 | 214 | 358 |
| October | 175,351 | 61,395 | 25,923 | 287 | 679 |
| November | 225,410 | 66,168 | 20,286 | 341 | 1,111 |
| December | 155,634 | 21,760 | 14,954 | 715 | 1,041 |
| 1938 | |||||
| January | 121,113 | 32,357 | 13,312 | 374 | 910 |
| February | 106,172 | 50,935 | 5,719 | 208 | 1,856 |
| March | 154,868 | 53,914 | 20,395 | 287 | 759 |
| April | 176,414 | 75,840 | 20,390 | 233 | 865 |
| May | 92,907 | 80,792 | 15,810 | 107 | 588 |
| June | 102,813 | 49,602 | 23,368 | 207 | 440 |
Source image
Source data: U.S. NLRB Annual Reports (public domain). Reconstruction by NLRB Stats Archive. Updated June 2026.