NLRB Stats Archive › Annual Reports › FY1938 › Cases brought before NLRB compared with strikes for all causes and for organization
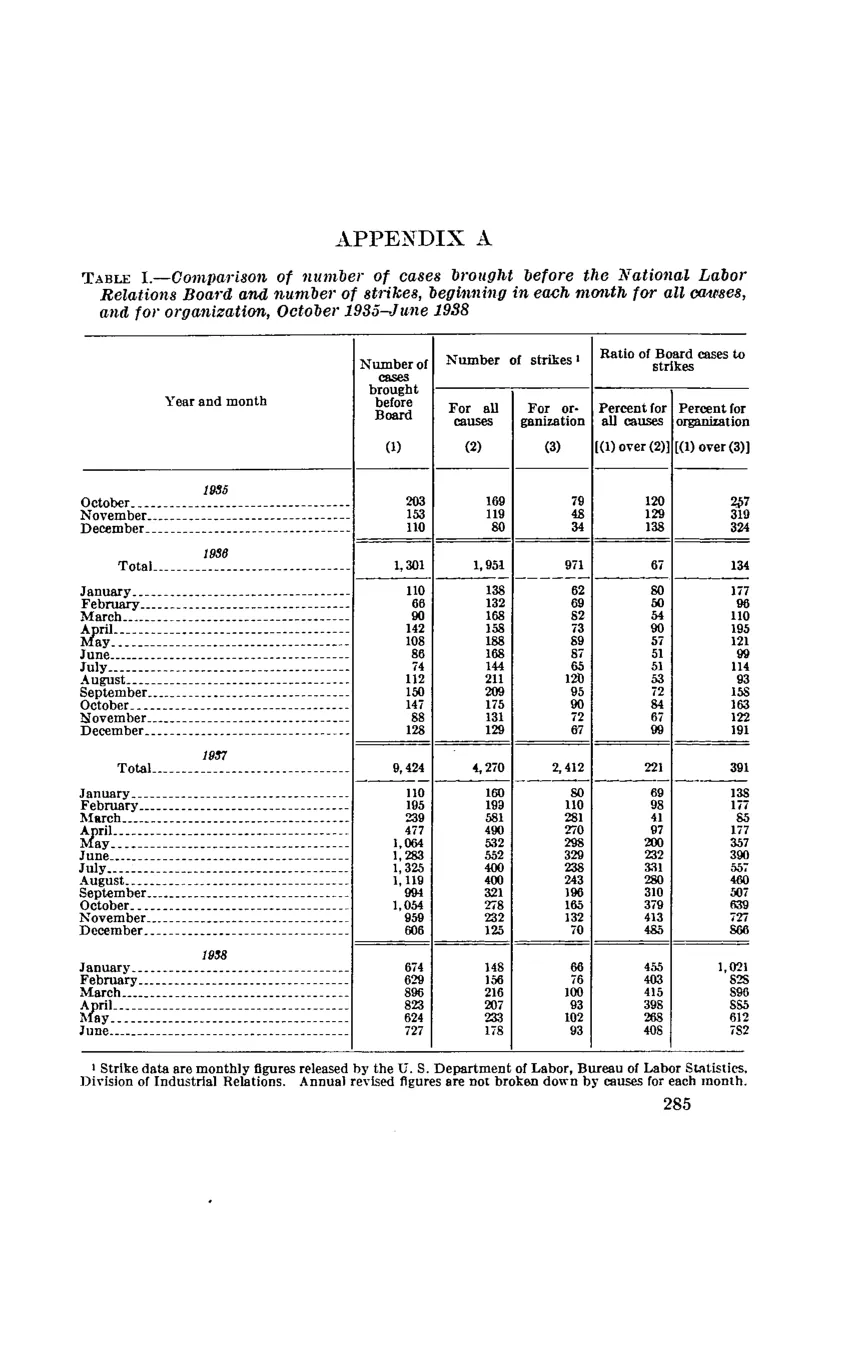
Cases brought before NLRB compared with strikes for all causes and for organization
| Year and month | Number of cases brought before Board (1) | Number of strikes For all causes (2) | Number of strikes For organization (3) | Ratio of Board cases to strikes Percent for all causes [(1) over (2)] | Ratio of Board cases to strikes Percent for organization [(1) over (3)] |
|---|---|---|---|---|---|
| 1935 | |||||
| October | 203 | 169 | 79 | 120 | 257 |
| November | 153 | 119 | 48 | 129 | 319 |
| December | 110 | 80 | 34 | 138 | 324 |
| Total | 1,301 | 1,951 | 971 | 67 | 134 |
| 1936 | |||||
| January | 110 | 138 | 62 | 80 | 177 |
| February | 66 | 132 | 69 | 50 | 96 |
| March | 90 | 168 | 82 | 54 | 110 |
| April | 142 | 158 | 73 | 90 | 195 |
| May | 108 | 188 | 89 | 57 | 121 |
| June | 86 | 168 | 87 | 51 | 99 |
| July | 74 | 144 | 65 | 51 | 114 |
| August | 112 | 211 | 120 | 53 | 93 |
| September | 150 | 209 | 95 | 72 | 158 |
| October | 147 | 175 | 90 | 84 | 163 |
| November | 88 | 131 | 72 | 67 | 122 |
| December | 128 | 129 | 67 | 99 | 191 |
| Total (1936) | 9,424 | 4,270 | 2,412 | 221 | 391 |
| 1937 | |||||
| January | 110 | 160 | 80 | 69 | 138 |
| February | 195 | 199 | 110 | 98 | 177 |
| March | 239 | 581 | 281 | 41 | 85 |
| April | 477 | 493 | 270 | 97 | 177 |
| May | 1,064 | 532 | 298 | 200 | 357 |
| June | 1,283 | 552 | 329 | 232 | 390 |
| July | 1,325 | 400 | 238 | 331 | 557 |
| August | 1,119 | 400 | 243 | 280 | 460 |
| September | 994 | 321 | 196 | 310 | 507 |
| October | 1,054 | 278 | 165 | 379 | 639 |
| November | 959 | 232 | 132 | 413 | 727 |
| December | 606 | 125 | 70 | 485 | 866 |
| 1938 | |||||
| January | 674 | 148 | 66 | 455 | 1,021 |
| February | 629 | 156 | 76 | 403 | 828 |
| March | 896 | 216 | 100 | 415 | 896 |
| April | 823 | 207 | 92 | 398 | 895 |
| May | 624 | 233 | 102 | 268 | 612 |
| June | 727 | 178 | 93 | 408 | 782 |
Source image
Source data: U.S. NLRB Annual Reports (public domain). Reconstruction by NLRB Stats Archive. Updated June 2026.